Preview table of contents and sample pages

About The 2026 Report
The global sports industry is more than a source of entertainment. It is an economic powerhouse, generating an estimated $2.86 trillion in revenues in 2025 and ranking as the eighth largest industry in the world. Capturing this scale requires a model that goes beyond narrow definitions to reveal the true scope, structure, and size of sports business.
Sports Industry Ecosystem: Narrow definitions of sports have historically left out major revenue sources, such as outdoor recreation, equestrian activities, and participation fees. We take a much broader view, capturing all dimensions of sports—from where sports fans spend their money watch and wager on, to the products consumers buy, and fees participants pay. Our sports industry ecosystem is organized around three domains and nine core areas based on sports fan spending, consumer sports product purchases, and fees paid for sports participation.

Best-Howard Model: These nine core areas and 37 distinct revenue-producing segments that allow us to competently measure the revenues of the sports industry. As important, this model allows us to understand how this level of revenue is obtained across a sports industry ecosystem. Using this model, we provide estimates of global and U.S. sports industry revenues along with 2026 projections, which reach an all-time high of $3.05 trillion.
The content of this report should be of great interest and importance to sports business students, sports industry professionals and sports industry organizations.
Sports Industry Report
Contents
CONTENTS
Sports Industry Country Revenue Score
Top 10 Sports Countries
Sample Page 1
How Big Is the Sports Industry

This a question asked many times every day around the world a wide range of responses. Below is a sample of responses that can be found on a google search.
- The sports industry currently generates $159 billion in annual revenue (1)
- The global sports industry’s sales total $521 billion. (2)
- The global sports and recreation market are $1.7 trillion. (3)
Perhaps more frustrating these estimates do not provide any context to what is included in these estimates. This creates further confusion when asking the question per the size of the sports industry. Without a sports industry definition it is impossible to know what is being measured and hence provide some context for these estimates.
The purpose of this report is to provide a comprehensive definition of the sports industry and its structure that allows for a transparent estimate of sports industry revenues used to estimate the total revenue of the worldwide sports industry. Let’s start with the known definitions of the sports industry and what may be missing in these definitions. Again, without a precise definition of what the sports industry is, one cannot measure its size in revenues.
DEFINING THE SPORTS INDUSTRY
While there are many wildly different estimates of the sports industry, few define provide a definitive summary of what they measured to arrive at their estimate of global revenues. Hence, we started with an extensive examination of previous efforts to define and measure the sports business industry. It is worth noting that the U.S. government does not have a single definition for sport. However, we found four publications that provide a sports industry definition which provided a basis for measuring the size of the sports industry.
Copyright 2026 The Business of Sports
1
Sample Page 8
Sports Industry Report
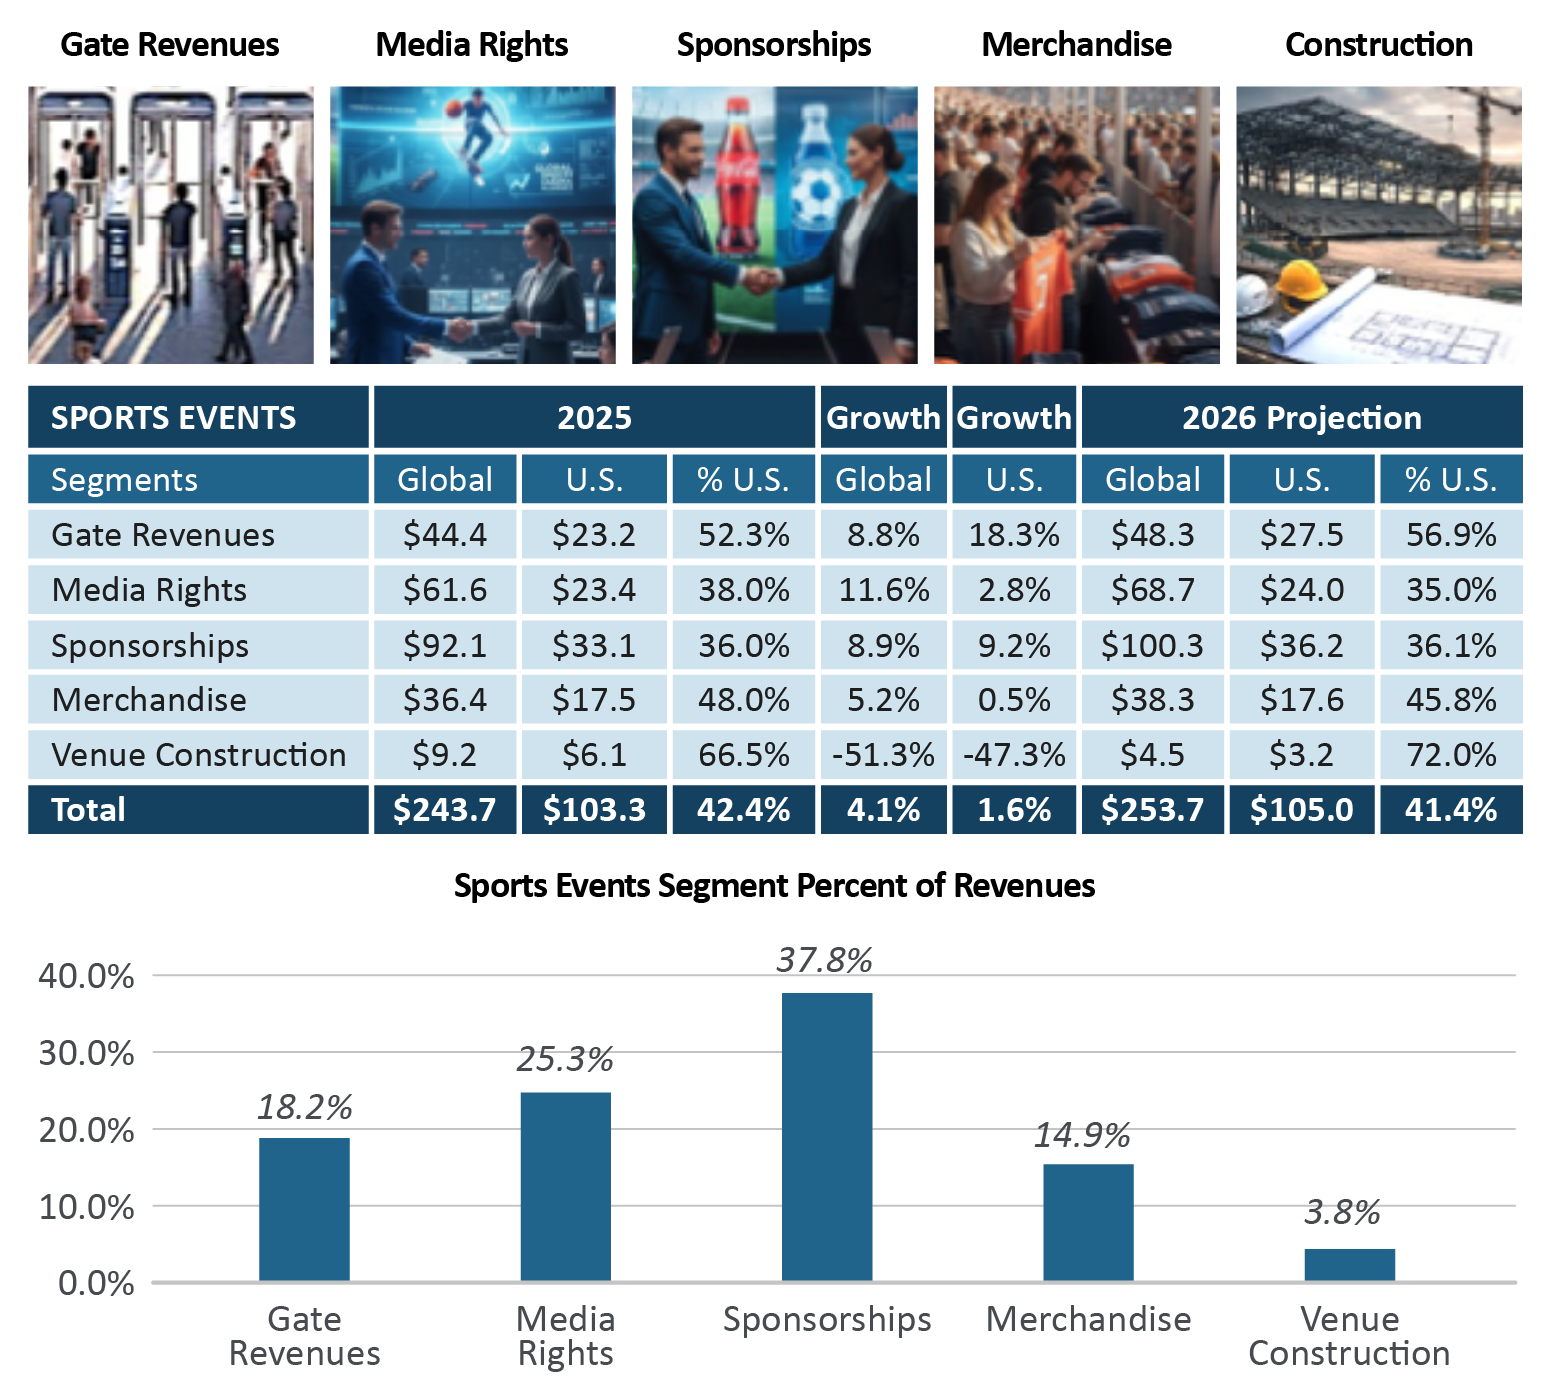
The largest revenue segment, corporate and brand sponsorships accounted for 37.8% of global sports events revenues, followed by the fastest growing source, media rights sales at 25.3%. In 2025 the United States was 42.4% of global revenues. In 2026 global revenues are projected to $253.7 billion. The U.S. is projected to grow at a slower rate (1.6%) and as a result the percent of global revenues in 2026 are projected to be down 1% to 41.4% as shown in Figure 5.
FIGURE 4
Sports Events Revenue Segments (billions)
SPORTS MEDIA: The second core area of fan engagement, Sports Media, provides the medium through which most fans experience live sports events. For many sports fans across the globe, the only way they will experience a live sports event is by watching it on a television, computer or mobile device or listening to it on the radio. Traditional TV and cable, as well as digital streaming networks generate revenues from two principal sources: 1) commercial advertising and 2) subscription fees. These revenue elements are differentiated between traditional TV and internet-based streaming platforms to illustrate the significant differences between each broadcast medium below.
8
Copyright 2026 The Business of Sports
Sample Page 11
Sports Industry Report
SPORTS PRODUCTS REVENUES
This sports industry of purchased sports products includes sportswear, sports equipment and sports health purchases by athletes for playing their sport and non-athletes engaged in their sport, outdoor recreation as well as those simply buying sports products for their performance, comfort and style.
- Sportswear – Sports footwear, apparel and wearable devices.
- Sports Equipment – Equipment for sports and fitness, outdoor recreation, and recreation vehicles from golf carts, jet skis, snowmobiles to camper trailers and trucks and all-terrain vehicles.
- Sports Health – Sports medicine, sports wellness products, sports therapy and sports drink, energy bars and nutrition supplements.
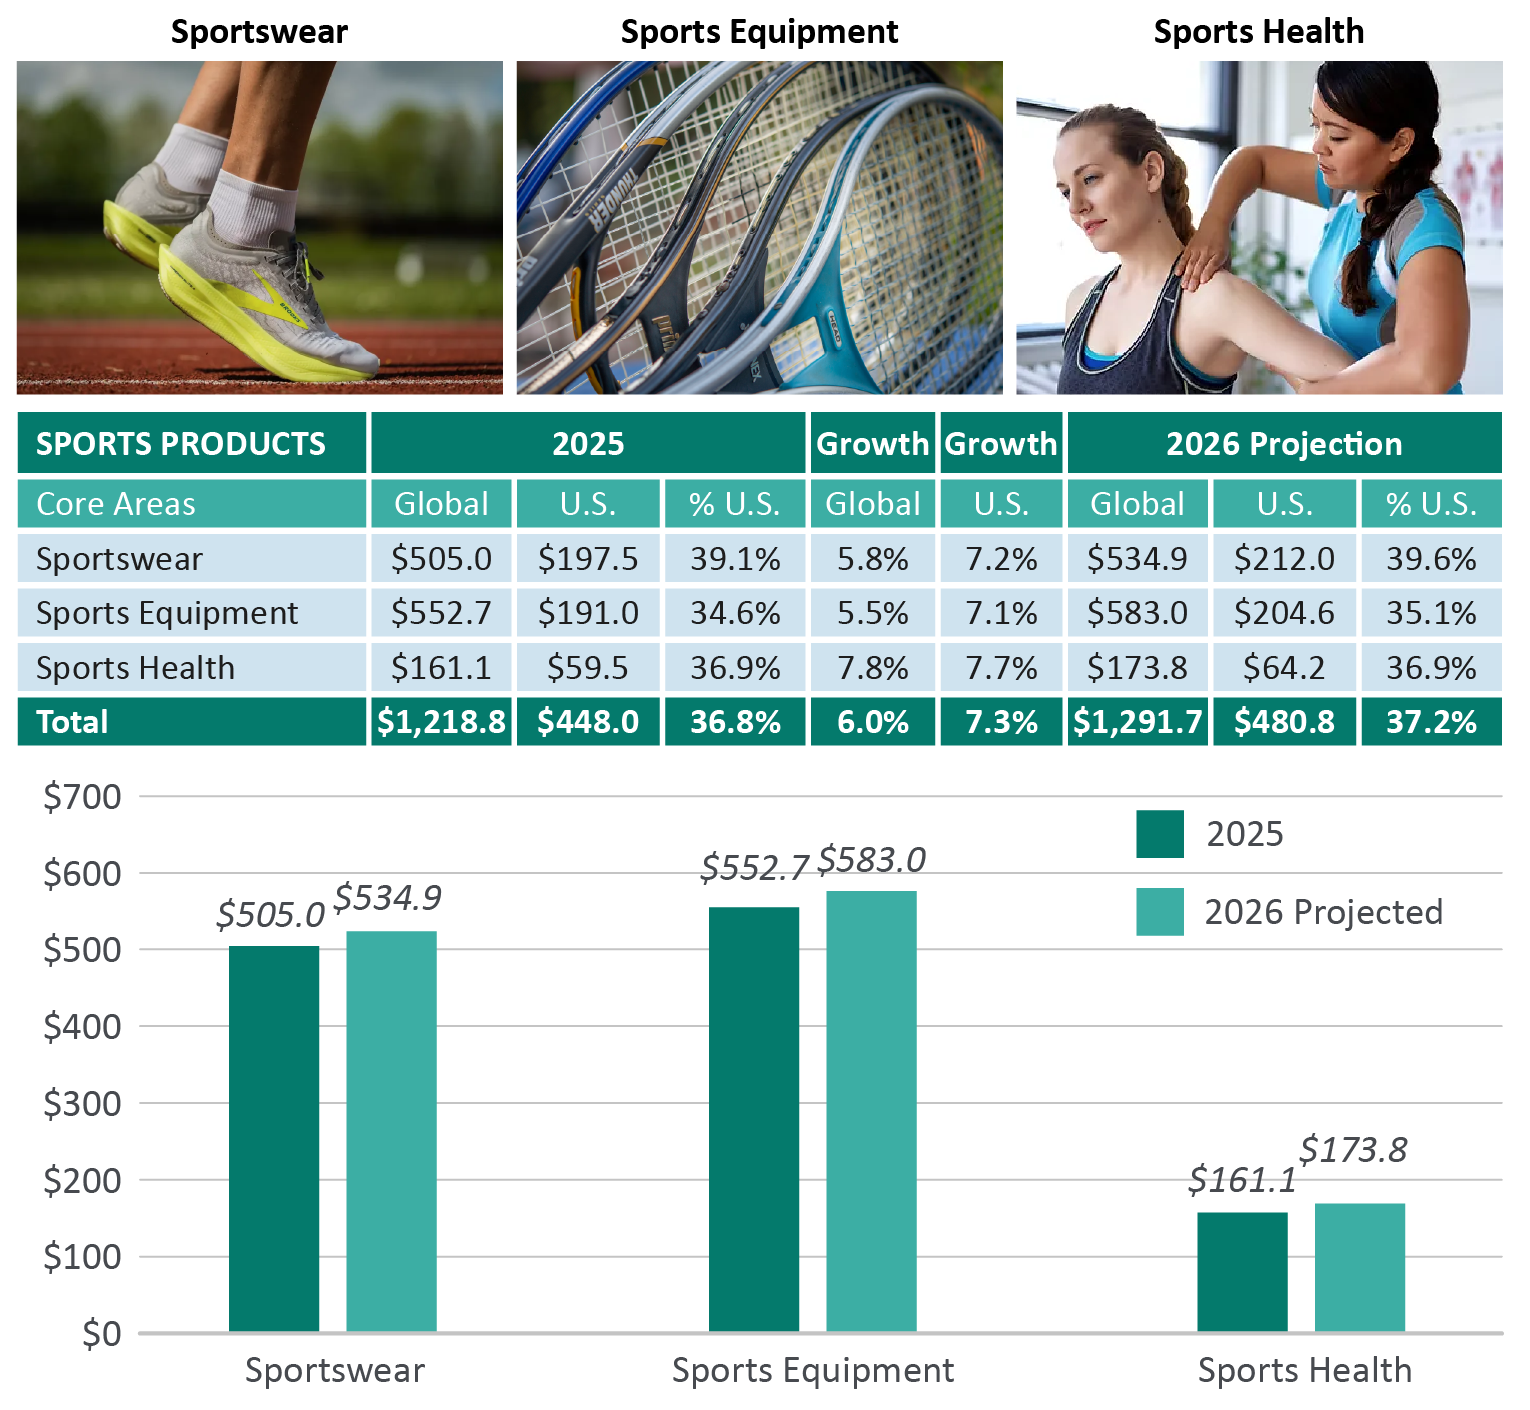
Sports product revenues and revenues for these three core areas are reported in Figure 7 for 2025 and projected revenues for each in 2026. Global sports product revenues are projected to grow 6% from $1.22 trillion in 2025 and to $1.29 trillion in 2026. The U.S. share of global revenue in 2025 was 36.8%, and its share is projected to increase to 37.2% in 2026.
Sports equipment is the largest sports products core area will grow 5.5% worldwide and 7.1% in the U.S. Sportswear is slightly lower in sports industry revenues but growing at a high rate worldwide (5.8%) and in the U.S. (7.2%). Sports health, while considerably smaller in revenues is growing at rates just below 8% worldwide and in the U.S.
FIGURE 7
Sports Products Revenues (billions)
Copyright 2026 The Business of Sports
11