To our wives, Robin and Lin, for their continuous support and encouragement over 3 years of work on this book.
Copyright © Global Sports Insights, LLC 2022 All Rights Reserved.
Manufactured in the United States of America. No part of this book may be reproduced in any form or by any electronic or mechanical means including information storage systems without permission in writing from the authors, except a reviewer, who may quote passages in the review.
Published by Global Sports Insights, LLC, 716 Kimwood Place, Eugene, Oregon 97401 (541) 484-5209
The Global Sports Industry
Must-Have Resource
MUST-HAVE RESOURCE
The sports industry is a $2.3 trillion global economic engine and among the top 10 worldwide business sectors. The Best-Howard Model described in The Sports Industry works from the bottom up with well-defined sports segment revenue measures aggregated into three core areas. Prior reports of sports industry revenues varied from $450 billion to $1.3 trillion and rarely detailed how their estimates were determined.
The Best-Howard Model’s well-defined structure relies on more than 250,000 sports industry data points. The model is global in scope but local in detail, as it includes country- and city-level revenues. The Sports Industry is available as a digital book featuring direct links to the model’s underlying data.
The Sports Industry reports revenues by country alongside population and economic data. The strategy allows readers to understand how and why revenues vary around the globe. The digital book offers interactive tables and graphs describing sportswear sales per household versus disposable income for the top 25 countries based on revenues. Click on country GDP, consumer spending or population age to gain insights into how revenues vary. For example, annual sportswear spending per U.S. household is almost $1,100, while it is $696 in Norway, $108 in Brazil, $29 in India and $166 on average worldwide.
The Sports Industry digital book is updated annually. While the most recent sports industry data is critical, the book also offers strategic insights into the numbers and deep understanding of every aspect of the industry. Beyond revenues, the book examines the sports and outdoor activities inspiring industry trends. The United States accounts for about 37% of the global sports industry. This book provides detail on how the revenues are produced and examines the remaining 63% worldwide.
The Sports Industry is a must have resource for students studying sports and professionals working in the industry, as well as journalists, advertisers, government agencies and investors. And the book’s trove of sports industry revenue data and analysis is available at all times on any digital device.
i
Copyright 2022 Global Sports Insights
The Global Sports Industry
Authors
AUTHORS
ROGER BEST: Dr. Best is an Emeritus Professor in Marketing at the University of Oregon and co-founder of the UO Sports Product Management Program. He is the author of Market-Based Management, over 40 marketing publications and The Academy of Marketing Science article of the year. Recent publications include “To Cut Cost, Know Your Customers, Sloan Management Review and “Customer Satisfaction: An Organizing Framework for Strategy,” Journal of Marketing Research.
Roger started his career at GE in engineering and product management where he earned a patent. As a professor he has taught at the University of Arizona, INSEAD in Fontainebleau, France, and University of Oregon. He has been awarded numerous teaching awards and honored as AMA Distinguished Teacher of the Year. He currently serves on the advisory board for the UO Lundquist College of Business.
Roger has worked extensively in consulting and executive education with companies including 3M, Dow, DuPont, ESCO, GE, HP, James Hardie, Lucas Industries, Media One, Tektronix, Sprint and US West. He also developed several commercial products, which include the Marketing Excellence Survey, BIDSTRAT, Mark-Plan, and Marketing Metrics Handbook.
DENNIS HOWARD: As an educator, author, and consultant, Dennis’ focus has been on the financial and economic aspects of sport over the past 30 years. He has been on the faculty at Texas A&M, Penn State, Ohio State and over the last 20 years at the Lundquist College of Business at the University of Oregon. He has received outstanding teaching awards at every institution he served. In 2008, Dennis was endowed a Philip H. Knight Professor of Business.
He has published nearly 100 academic and professional articles and authored several books, including the most recent, Financing Sport (4th edition) with his long-time colleague and friend, John Crompton. Dennis is co-editor (with Brad Humphreys) of the 3-volume series, The Business of Sport. He is also the founder and former editor of the International Journal of Sport Finance. For his scholarly contributions, Dennis was the recipient of the North American Sport Management Association’s prestigious Earle F. Ziegler Award.
At the University of Oregon, Dennis served for many years as the Academic Director of the James H. Warsaw Sports Marketing Center, which developed the first MBA program dedicated to the business of sport. The program’s success has inspired many universities to establish sport-specialty programs in business schools around the globe. Dennis also served as the Head of the Marketing Department and Dean of the Lundquist College of Business. He is now an Emeritus Professor of Marketing and Sports Business.
Copyright 2022 Global Sports Insights
ii
The Global Sports Industry
Acknowledgements
ACKNOWLEDGEMENTS
KRISTY NEVES: Kristy is a partner with Global Sports Insights, LLC and manages the overall database, and business operations. She has over 25 years in database, systems management, & accounting. Most recently, (2008-2019), she managed a large marketing manager database and information system for Gartner.
OLIVER BEST, MILLIE VELASQUEZ & IRENKA ANGELOVA: Oliver and Millie provide the graphics, production and website, as well as a website video and payment system. Irenka leads GSI market research, and all three participate in social media marketing. Their contribution to the creation and production of this book was invaluable.
GLOBAL SPORTS INSIGHTS INTERNS: We have had many outstanding interns who have done incredible research on the sports industry. They attended weekly team meetings and contributed student perspectives we would have not considered without their user insights. To each we are extremely grateful for the work they have provided.
GRADUATE INTERNS
University of Oregon, Sports Product Management Masters Program
– Ben Hogan, (Summer 2018)
– Nathan Trautman, (Summer 2019)
– Sherry Dai, (Summer 2019)
– Narkie Nartey, (Summer 2020)
– Krystal Yeh, (Summer 2021)
– Josh Daniel, (Summer 2021 to Spring 2021)
– Kyle Crawford, (Fall 2021 to Spring 2022)
– Maren Troitsky, (Fall 2021 to Spring 2022)
University of Oregon, Warsaw Sports Business MBA Program
– Ofuma Eze-Echesi, (Summer 2019 & Fall 2020)
– David Borlack, (Fall 2020)
– Landon Wright, (Fall 2021 to Spring 2022)
– Andy Fain (Fall 2021 to Spring 2022)
UNDERGRADUATE INTERNS
University of Oregon, Sports Business Program
– Maggie Bidasolo, (Fall 2020)
– Abby Dolioso, (Fall 2020)
– Braden Buerk (Fall 2021 to Spring 2022)
– Issa Malik (Fall 2021 to Spring 2022)
– Meagan Kiefer (Fall 2021 to Spring 2022)
University of Oregon, Journalism School
– Chloe Colligen, (Fall 2020)
American University – Nicaragua
– Irenka Angelova (Summer 2020, Summer & Fall 2021)
We would also like to make a special thank you to Dean Sarah Nutter, Lundquist College of Business who provided two summer internships when starting this project, Professor Bettina Cornwell who helped start the research of this book, and John Elkins for his generous support of eight year-long internships and Dr. Ellen Schmidt-Devlin for her spirited encouragement.
We would also like to thank Elizabeth Brock-Jones, Nike Senior Developer for her detailed comments and edits that set the direction of our book. Paul Swangard and Merryn Huntley Roberts for providing valuable feedback and encouragement. We would like to recognize Katy Lenn, UO Reference Librarian who was of great assistance throughout this project. We also want to thank copy editor Shea Gibbs. His detailed copy editing and writing of our chapters were a humbling experience but a much needed level of professional writing.
iii
Copyright 2022 Global Sports Insights
The Global Sports Industry
Contents
CONTENTS
PART I: Structure of the Sports Industry
Chapter 1: Defining The Sports Industry - Scope, Structure & Size
PART II: Fan Engagement
Chapter 2: Sports Events - The Heart of the Sports Industry
Chapter 3: Sports Media - Extending Fan Engagement
Chapter 4: Sports Entertainment - Extending Sports Enjoyment
Sports Betting
U.S. Sports Betting
Online/Mobile Betting
The Sports Gambling Ecosystem
The Ultimate Fan Engagement: In-Game Micro betting
Sports Betting Around the Globe
Fantasy Sports
Esports
Esports Revenues
China’s Esports Boom
Sports Video Games
Sports Movies, Books & Memorabilia
Sports Movies
Sports Books
Sports Memorabilia
Sports Bars
COVID-19’s Impact on Sports Entertainment
PART III: Sports Products
Chapter 5: Sportswear - Sport, Athleisure & Work
Chapter 6: Sports Equipment - Sports, Fitness & Recreation
Sports & Fitness Equipment
Team Sports
Individual Sports
Fitness Equipment
Outdoor Recreation Equipment
Camping
Fishing
Hunting
Wildlife Watching
Water Sports
Snow Sports
Equestrian
Recreational Vehicles
RV Motor Vehicles & Trailers
Recreational Boats
All-Terrain Vehicles
Jet Skis
Golf Carts
Snowmobiles
COVID-19’s Impact on Sports Equipment
Chapter 7: Sports Health & Wellness - Medicine, Therapy & Nutrition
Sports Medicine
Wellness Products
Sports Concussion Products
Orthopedic Braces
Orthotics
Compression Clothing
Healthcare Wearables
Sports Therapy
Chiropractic Therapy
Therapeutic Massage
Sports Acupuncture
Cryotherapy
Compression Therapy
Psychological Counseling
Sports Nutrition
Sports Drinks
Performance Supplements
Energy & Protein Bars
Copyright 2022 Global Sports Insights
iv
The Global Sports Industry
Contents
PART IV: Sports Participation
Chapter 8: Sports Recreation - Indoor & Outdoor
Chapter 9: Fitness & Exercise - Home & Gym
Chapter 10: Sports Outdoor Recreation - Active & Leisure
Camping
U.S. and Global Camping Revenues
Glamping
Hunting & Fishing
Participation
Annual Revenues
Snow Sports
U.S. and Global Annual Revenues
Estimated U.S. Snow Sports Participation
Water Sports
U.S. Water Sports Participation
U.S. Water Sports Participation Annual Revenues
Equestrian
Ownership Costs
Equestrian Participation Annual Revenues
COVID-19’s Impacts on Sports Participation
PART V: "Glocal" Vision
Chapter 11: Top 10 Sports Countries - Thinking Globally
Sports by Country
Country-Level Sports Passion
Country-Level Professional Sports Teams
Market Size: Country Population
Buying Power: Country Economy
Country-Level Sports Power Scores
Power Score Predictive Validity
Sportswear Revenues
Camping Equipment Revenues
Gym & Health Club Revenues
The Top 10 Sports Countries
Top 10 Country Profiles
COVID-19’s Impact on World Sports
Chapter 12: Top 50 Sports Cities - Acting Locally
What Makes a Sports City Unique?
Population & Purchasing Power
Sports City Streetwear & Sports
City-Level Sports Power Scores
North America
Europe
Asia-Pacific
Latin America
Middle East & Africa
Top 50 Sports Cities
City-Based Brand Strategies
Adidas’s Top Sports City Strategy
Nike’s Global City-Based Strategy
v
Copyright 2022 Global Sports Insights
GET INSTRUCTOR COPY TODAY!
The Global Sports Industry
Structure of the Sports Industry
Part I:
Structure of the Sports Industry
The sports industry includes a wide range of events, products and activities that engage people around the world. More than any other industry, sports are truly global and serve our planet with a unifying spirit of competition, enjoyment and health. Our goal in this book is to account for all these factors and explore how they shape the scope of the sports industry.
To understand the complexities of today’s global sports industry, let us consider where it came from and how it evolved.
Sports and competition have been around as long as individuals could run faster, throw farther or jump higher than their peers. Sports and competition are an innate part of our human structure and cultural condition.
FIGURE I

Sports competition was first formalized in training soldiers to run, jump, fight and ride horses, as well as use poles, spears and rocks in combat. The intense training inevitably led to competition among soldiers. We can assume some observers even placed wagers on the contests. Hence, one of competitive sports’ first derivatives may have been betting. The early period also produced the first signs of sports-as-entertainment and the importance of fan engagement.
Military competitions eventually led to the inaugural Olympic games in 776 BCE (Figure I). The games were the first documented organized sports competition with athletes, events, spectators and a venue. The events included boxing, discus, equestrian, long jump, javelin, running and wrestling.
Copyright 2022 Global Sports Insights
1
The Global Sports Industry
Structure of the Sports Industry
Beyond entertainment, what motivated the first Olympic competition? Many would be surprised to learn the answer is war. The Olympic Truce is a tradition originating in ancient Greece the year of the first games. The laying down of arms was announced before and enforced during the competition to ensure the host city-state was not attacked and athletes and spectators could travel safely to and from the games.
From the beginning, sports and competition played a positive role in society, bringing together people traditionally at war.
SPORT CREATION: While the origins of sports are generally traced to 776 BCE, sports emerged in the years between the first Olympics and 1850. The new sports and their rules evolved primarily in Europe, with some coming to be in Asia. Their development also led to the first cataloguing of world records.
FIGURE II
Sports Developed by 1850
The era between 776 BCE and 1850 saw the creation of the sports shown in Figure II. For the most part, sports venues at the time consisted of fields, courts and pools. Unlike the giant arenas where the ancient Greeks and Romans showcased their skills, the new venues had limited room for spectators. The sparse seating offered the only form of sports fan engagement, aside from informal wagers among spectators.
FIGURE III
Sports Developed From 1850 to Today
2
Copyright 2022 Global Sports Insights
The Global Sports Industry
Structure of the Sports Industry
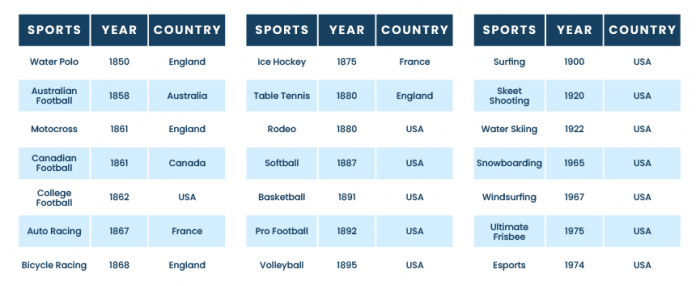
The modern sports era began around 1850 and continues today. Shown in Figure III are many of the sports evolving during the period. In the early years, a dramatic shift occurred, with new leagues, teams and stadiums added for a variety of sports like baseball, football, basketball, ice hockey, water sports, bicycle racing and auto racing. By 1880, the United States became a driving influence in sports creation. As the new sports drew greater interest with the support of emerging media, fan engagement and venues showcasing the events also grew.
THE SPORTS INDUSTRY: As sports venues grew in size and complexity, sponsors rushed to put their brands alongside events. Merchandise and broadcast media began to contribute a large part of the revenues produced by sporting events.
Emerging technology drove the growing sports media and allowed events to reach audiences outside the venues in which they were played. The telegraph allowed scores to be shared, and radio broadcasts allowed fans to listen to entire events. Television, cable TV and later live internet streaming allowed more fans to watch and listen to events than could attend them. The new broadcast audiences quickly attracted new advertisers and sponsorships. The wide array of sports that could be viewed from almost any location also opened the market for sports betting and the evolution of sports entertainment products, including fantasy sports, video games and sports bars.
Athletes participating in sports need footwear, apparel and equipment. All sports require at least some specialized equipment and sportswear. Companies emerged to make balls, bats, sticks, rackets, golf clubs and poles, as well as mitts, gloves and skis. Over time, style and fashion became critical among sports products, as did health products like hydration beverages, energy bars and nutritional aids. Today, athletes rely on their health and wellness to compete, and innovations in medicine and physical therapy have become a large and growing part of the massive sports industry.
Sports have also come to include outdoor recreation, including camping, rafting, fishing and hunting. The evolution of gymnasiums for boxers and weightlifters—and later health and fitness clubs—expanded sports participation into the exercise arena. Boating and recreational vehicles drew even more individuals to outdoor recreation.
Each new area of the sports industry has come to generate revenue around the world. While the U.S. market is the largest for most sports, the rest of the world still contributes more than 60% of worldwide revenue.
In Chapter 1 of this book, we review past definitions of the sports industry and provide a comprehensive scope and structure to measure its size accurately. While we attempt to present an accurate picture of today’s global sports industry, one thing is certain: The industry will continue to change as it evolves with new sports, ways to view and enjoy sports, products and ways to participate in sports and outdoor recreation. And as worldwide prosperity grows, more of the world’s population will become part of the sports industry. We can also expect the industry will continue to play a growing role in worldwide health and wellness.
Copyright 2022 Global Sports Insights
3
GET THE ONLINE BOOK TODAY!
The Global Sports Industry
Defining the Sports Industry

Scope, Structure & Size
Sports are universal. Around the globe, sports teams perform before enthusiastic fans at modern venues, and even larger audiences watch on TV or stream online. An increasing number of interested viewers now wager considerable sums on sports outcomes.
Millions of people of every race, ethnicity and nationality spend countless hours participating in their favorite sports and recreation activities and considerable money purchasing the equipment they need, from golf clubs to cricket bats. How much do the revenues generated by sporting events, participation costs (e.g., fees, lessons, travel), and sportswear and equipment purchases total?
It would seem to be a straightforward question. But the answer is complicated.
The Best-Howard Sports Industry Model systematically estimates the sports industry’s size using a unique, well-defined structure and scope (Figure 1.1). The model also offers a framework for understanding the 2020 COVID-19 pandemic’s impact on the sports industry and forecasting recovery prospects for many sectors in the near future.
FIGURE 1.1
What is the Sports Industry?

Most would expect a vast global industry, which inspires millions of people to spend countless hours and considerable money, to have up-to-date, accurate revenue figures and forecasts. Yet, revenue data for sports and recreation activities—including purchasing necessary equipment, paying fees to participate and buying sportswear has never before been available in one readily-accessible place.
Existing revenue estimates for the global sports industry range from $471 billion to $1.4
Copyright 2022 Global Sports Insights
5
The Global Sports Industry
Defining the Sports Industry
trillion. What leads to the nearly trillion-dollar discrepancy? Sports industry revenue estimates have traditionally lacked a well-defined structure and failed to measure all, or even the same, essential dimensions.
A closer look at the many available sports industry estimates raises several questions. How comprehensive are they? Do they encompass sports engagement from what consumers pay to attend or watch events to their spending on team merchandise and memorabilia? Do they capture the enormous corporate investments made in sports teams and events sponsorships and media rights partnerships? Do they incorporate the full range of available sportswear, including athleisure, and specialized gear and equipment? What about costs associated with direct participation in sports, fitness and outdoor recreation, as well as their expensive consequences like physical therapy? Finally, do the estimates fully attend to the world’s fastest-growing sports fan engagement segments, such as video games, fantasy sports, wagering and even sports movies?
Building A Comprehensive Model
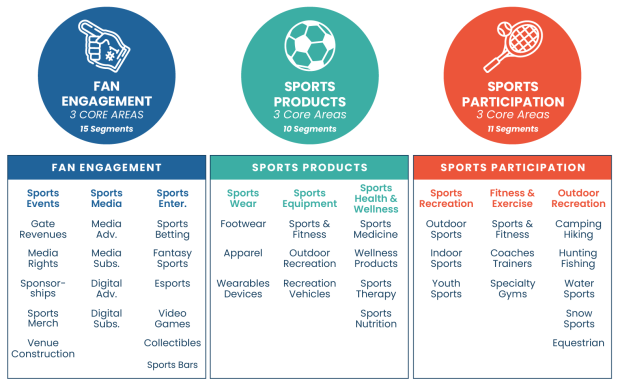
The Best-Howard Model fully captures the sports industry’s scope and structure. As shown in Figure 1.2, the model includes three core domains: Fan Engagement, Sport Products and Sports Participation. The domains capture the complete breadth and detail of the industry and provide a comprehensive structure for estimating the economic magnitude of sports and recreation activity worldwide. The domains and their core area breakdowns serve as a framework for collecting participation and spending data for every industry segment. The aggregated totals across the domains provide a composite measure of the sports industry’s overall size.
FIGURE 1.2
The Best-Howard Sports Industry Model
6
Copyright 2022 Global Sports Insights
The Global Sports Industry
Defining the Sports Industry
Existing efforts to model and measure the sports industry all suffer from one major challenge: The U.S. government does not recognize sports as a separate or standalone industry. As a result, it is impossible to find a single definition of what constitutes the industry or consolidated figure representing its economic magnitude. Sports-related activity segments are scattered, without apparent rationale, across several categories of the North American Industry Classification System (NAICS). Sports and Athletic Goods Manufacturing is classified under NAICS code 339920, while Spectator Sports is under 711219, and yet another category, Sports Teams and Clubs, is under 711211.
It is possible to combine figures across categories to estimate the size of the U.S. sports industry. Using Department of Commerce guidelines, researchers Milano and Chelladurai create a Gross Domestic Sports Product (GDSP) metric by aggregating “the market value of the nation’s output of sports-related goods and services”(1). Their analysis produces three GDSP estimates for the year 2005, ranging from a conservative $168.5 billion to $207.5 billion ($281 billion on the high-end accounting for 2020 inflation). The researchers’ use of the U.S. government classification system captures more relevant sports content than any other industry estimate. It is the only estimate to include entertainment and recreation activities, such as parimutuel betting and fantasy sports, and sports medicine.
While their estimate is broadly inclusive, Milano and Chelladurai recognize concerns related to its “ambiguous classification of certain expenditures related to the sport industry,” narrow sports gambling definition and reliance on data collected from nongovernment sources (e.g., the National Sporting Goods Association) for product-related expenditure estimates. While credible, the National Sporting Goods Association omits several prominent equipment and apparel categories, including for all equestrian sports and emerging outdoor activities like bouldering/mountaineering. The researchers’ estimate also ignores digital technology rapidly ascending in many sports dimensions, from wearable devices to online gambling and media streaming services. Finally, the estimate does not include global sports activity.
Plunkett Research (2) provides the most complete descriptive overview of the global sports market. It is one of many commercial firms offering sports industry market forecasts, trend analyses and financial performance data. The ReportLinker.com site Sports Industry 2021 contains thousands of market intelligence reports focused on the sports industry.
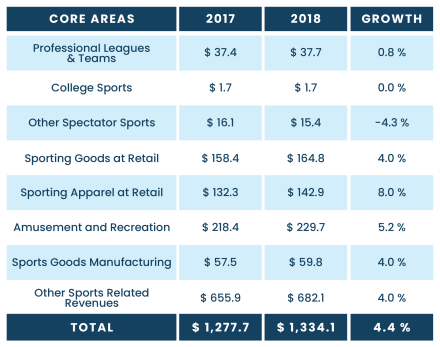
Plunkett’s Sports & Recreation Industry Almanac offers currency and a global perspective. The almanac provides an extensive description of the sports industry’s many products and services and the trends—particularly related to technology—influencing its growth. The industry overview recognizes the emerging prominence of esports, fantasy sports and sports betting and estimates the size of the U.S. and global sports and recreation markets. The 2020 Almanac estimates that 2018 U.S. sports market revenues reached $539.7 billion. The rest of the world’s spending amounted to $763 billion in 2018, bringing the global sports market’s estimated aggregate value to $1.33 trillion. Plunkett Research’s estimate (Figure 1.3) is far greater than those of most other commercial research outlets.
Figure 1.3 provides Plunkett’s breakdown of the revenue sources used to estimate the global sports market’s size in 2017 and 2018. The categories represent the breadth of the industry and include: 1) a range of spectator sporting events, 2) retail sportswear and equipment purchases, 3) the costs of participating in fitness, indoor and outdoor recreation and sports activities, and 4) diverse sports engagement opportunities bundled under the broad “Other”
Copyright 2022 Global Sports Insights
7
GET INSTRUCTOR COPY TODAY!
The Global Sports Industry
Defining the Sports Industry
heading. Plunkett’s “Other” category accounts for more than half of the firm’s estimated total $1.33 trillion spent globally on sports and recreation in 2018.
Figure 1.3
Plunkett’s Sports & Recreation Industry Almanac 2020 Global
Sports Revenues (U.S. billions)
Source: Plunkett Research Estimate, Plunkett Research, Ltd.
Note: Professional Leagues & Teams figures pertain to North America leagues only, and two corrections are made to 2017 figures, in which Professional Leagues & Teams revenues previously were $93.6 billion and total revenues were $1,333.8 billion.
Optimizing the Model
The data sourcing for the Plunkett Research estimate lacks specificity. The reference provided for Figure 1.3 does not include the underlying data used to arrive at each category’s revenue estimate. The Almanac’s limitations, therefore, are as follows:
• While Plunkett Research lists multiple credible data sources—including the U.S. Census Bureau, U.S. Bureau of Labor Statistics and Forbes—elsewhere in the Almanac, sources are not included for the tables showing revenue data, as in the Figure 1.3 example.
• All the Almanac’s references are U.S. sources and provide data exclusively attributable to American sports leagues, events and companies. The narrative portion of the Almanac includes participation and spending statistics from global organizations like the International Health, Racquet & Sportsclub Association, but the numbers are not referenced in data tables.
What sources does Plunkett Research use to reach its $1.34 trillion global estimate? The U.S. contribution, $539.7 billion, accounts for 41.5% of the total but leaves almost $800 billion of economic activity to the rest of the world.
8
Copyright 2022 Global Sports Insights
The Global Sports Industry
Defining the Sports Industry
The Best-Howard Model estimates the global sports industry is worth $2.3 trillion. The estimate is almost $1 trillion dollars greater than the next highest number. More extensive and credible sourcing is therefore required to understand the global sports industry.
Two other frequently referenced publications also offer sports industry market size forecasts, trend analyses and financial performance statistics. ResearchAndMarkets.com released a report in 2019 (3) estimating the value of the 2018 global sports market at $488.5 billion and projected growth to $614 billion in 2022. The growth figure has been widely referenced in news and journal reports around the globe.
In The Sporting Goods Industry, Richard Lipsey offers a detailed analysis of the major segments comprising the market (4). While Lipsey focuses primarily on consumer products and sports participants’ equipment, he provides a thoughtful overview of the cultural and technological dynamics influencing the industry’s shape and structure. His chapter on the U.S. industry’s size provides a template for capturing participation and spending data for a range of sports activities and product categories. While the data cited in Lipsey’s 2006 publication is no longer current, his approach to identifying and assembling data is a useful resource.
The Best-Howard Model uses nine core areas under its three primary domains to capture the size of the sports industry: Sports Events, Sports Media, Sports Entertainment, Sportswear, Sports Equipment, Sports Health, Sports Recreation, Fitness & Exercise and Outdoor Recreation. Each major sports industry model addresses the core areas to different extents. In Figure 1.4, the core areas are organized under the Best-Howard Model’s three domains. Comparing the models’ coverage breadth and depth, the number of stars in each column shows the extent to which the category is addressed, with three to zero stars representing complete, adequate, deficient and no coverage.
Figure 1.4
The Sports Industry Structure - Models
The Best-Howard Model to some degree represents a consolidation of the available market studies’ common elements. ResearchAndMarkets.com provides sufficient transparency to include a representation of the firm’s model, the Milano and Chelladurai paper serves as a foundation for the Best-Howard Model’s development and the Plunkett Research Group offers the most comprehensive inventory of sports categories and activities and includes global estimates.
Copyright 2022 Global Sports Insights
9
The Global Sports Industry
Defining the Sports Industry
The video below (Figure 1.5) provides an overview of the Best-Howard sports industry domains and core areas highlighted in Figure 1.4. We belief the scope of this sports industry more is more comprehensive, and the structure offers and better organization.
Figure 1.5
Overview of the Sports Industry
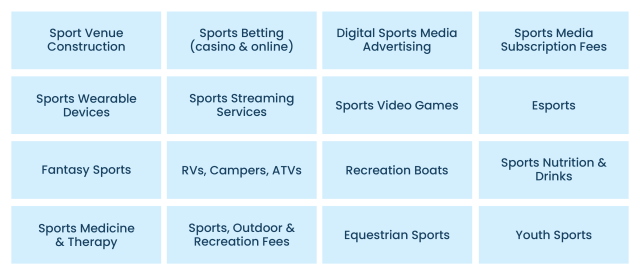
The Best-Howard Model’s comparative analysis reveals many sports products and service areas are either missing from the other prominent models or only partially covered. The missing or incomplete elements are shown in Figure 1.6.
FIGURE 1.6
Missing Elements of a Sports Industry Model
Understanding the Best-Howard Model
The Best-Howard Model, shown in Figure 1.7, includes each of the features missing from other prominent sports industry models. The model includes an inventory of 36 categories, known as segments, with participation and revenue data collected for each. The model assigns each segment to one of the three major domains—Fan Engagement, Sports Products and Sports Participation—and each domain is further divided into three core areas.
10
Copyright 2022 Global Sports Insights
GET THE ONLINE BOOK TODAY!
The Global Sports Industry
Defining the Sports Industry
FIGURE 1.7
BEST-HOWARD MODEL: Domains, Core Areas Segments
DOMAIN I: Fan Engagement – Experiencing. Fan Engagement includes all sports fan-related experiences, including attending sporting events, watching them on a preferred media platform and participating in sports entertainment like fantasy sports, video games and wagering. All are ways in which fans engage with their preferred sports.
Fan Engagement includes the core areas Sports Events, Sports Media and Sports Entertainment. Each core area is subdivided into four to six segments representing distinctive revenue-producing categories.
The Sports Entertainment core area includes several of the world’s fastest growing activity segments—sports betting, esports and fantasy sports. Increased worldwide internet access and smartphone use, coupled with many new and attractive mobile applications, allow hundreds of millions of people around the globe to engage in sports in ways not possible a decade ago.
Today, fans can wager, manage their own fantasy sports teams and watch the world’s best video gamers compete directly on their mobile devices. The 2020 global COVID-19 pandemic accentuated the activities’ entertainment appeal. With live attendance limited, fans found easily accessible online platforms an attractive way to engage with their favorite sports.
Wagering on sports has also become a popular form of engagement. Legal betting on games and matches around the world topped $250 billion in 2020, making it the single highest revenue-producing segment in the Best-Howard Model.
The Sports Events core area includes five segments, which analysts PricewaterhouseCoopers and Deloitte use in their financial reviews of the global sports market and European soccer leagues:
Copyright 2022 Global Sports Insights
11
The Global Sports Industry
Defining the Sports Industry
1. Gate revenues (ticket sales, food and beverage sales, etc.).
2. Media rights.
3. Sponsorships.
4. Merchandise sales.
5. Sports venue construction costs.
Sports Events are the wellspring of engagement. Without league games, matches, tournaments and road races, fans would have nothing to watch, stream and bet on. Much of the Best-Howard Model depends on fan-engaging events. And the event producers—from professional sports leagues to the Boston Marathon—depend on revenues produced from ticket sales, registration fees, television broadcast rights, and corporate sponsorships and licensed merchandise.
The growing worldwide, interdependent fan engagement ecosystem includes both media companies televising and streaming sporting events and corporate partners aligning their brands with highly visible sports properties. The Sports Media core area and its prominent role in engaging sports fans represents a significant opportunity as media outlets increasingly target digital devices and streaming platforms. All the segments included in the core area of Sports Entertainment, such as wagering and fantasy sports, are also integral to the Fan Engagement ecosystem and highly dependent on a robust sports events calendar.
DOMAIN II: Sports Products – Using. The Sports Products domain includes the core areas Sportswear, Sports Equipment, and Sports Health, which covers sports medicine, nutrition and sports drinks. The domain includes all products athletes and consumers use in sports, exercise, recreation and everyday living.
Sports Equipment includes the specialized gear used across three major areas of sports and recreation—mainstream recreational sports like golf and tennis, gym and fitness activities from yoga to CrossFit, and outdoor pursuits like hunting, fishing and backpacking. The closely related recreational vehicles segment recognizes the growing popularity of campervans, caravans, camper trailers, truck campers and all-terrain vehicles.
The Sportswear core area focuses on specialized footwear and clothing designed for engaging in sports and recreation activities, as well as wearable health monitors and smart watches. The Best-Howard Model also highlights the growing trend of sportswear being used in everyday, non-sports contexts—from the workplace to leisure activities—leading to a new fashion category, Athleisure.
The third core area in the Sports Equipment domain, Sports Health, is often overlooked but rapidly growing. Consumer spending related to sports medicine and nutrition products collectively surpassed $50 billion worldwide in 2020.
DOMAIN III: Sports Participation – Doing. Sports Participation includes all the sports activities in which people engage as direct participants. In addition to traditional sports, the domain includes fitness and exercise-based events and recreational sports.
Sports Participation includes three core areas: Sports Recreation, Fitness & Exercise and Outdoor Recreation. An abundance of credible data shows the number of people in the United States participating in sports and recreation activities in each of the core areas.
12
Copyright 2022 Global Sports Insights
The Global Sports Industry
Defining the Sports Industry
Credible annual spending data are provided for a number of sport and recreation activities by U.S. government organizations. The U.S. Fish and Wildlife Service, U.S. Forest Service and National Park Service collect annual data on user, licensing and permit fees related to hunting, fishing, camping and boating. In addition, sports industry trade associations (e.g., for fitness and health clubs, golf, boating and downhill skiing) report annual revenues from membership fees, greens fees, ski passes, moorage fees, etc. The Best-Howard Model draws on the data wherever available to complement its participation trends analysis in 12 Sports Participation segments. Of special consideration are the challenges facing youth sports organizations, such as declining participation, rising costs and their role in combating the growing obesity crisis.
The Best-Howard Model: Scope & Size
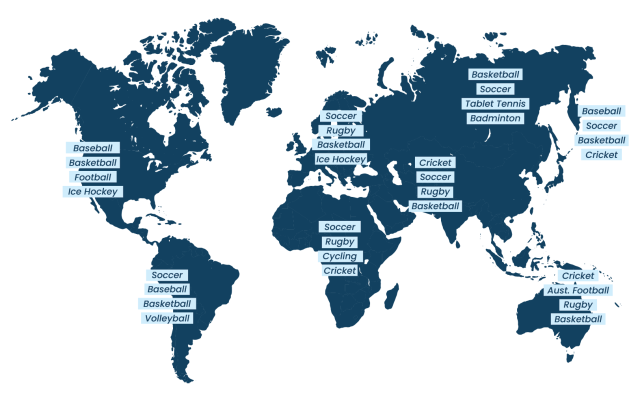
The Best-Howard Model provides a broad and inclusive sports industry outlook, both from a geographic and content perspective. Figure 1.8 highlights the most popular sports around the world (5). By some measures, soccer is the one true global sport. It has a passionate following in most world regions, highly developed sports leagues and prolific participation at the recreational and amateur levels. The same devotion is shown for cricket in India and Pakistan and American football in the United States, but both are geographically limited.
FIGURE 1.8
The Best-Howard Model’s Global Perspective
WORLDWIDE SPORTS FANS

Soccer
3.5 Billion

Cricket
2.5 Billion
Click Here
Basketball
2.4 Billion
Click Here
Hockey
2.2 Billion
Click Here
Tennis
1 Billion
Click Here
Volleyball
900 Million
Click Here
Table Tennis
850 Million
Click Here
Baseball
500 Million
Click Here
Football
410 Million
Click Here
Rugby
400 Million
Click HereCopyright 2022 Global Sports Insights
13
GET INSTRUCTOR COPY TODAY!
The Global Sports Industry
Defining the Sports Industry
Basketball, tennis and volleyball are also played in every world region. More people watch NBA basketball in China than any other nation outside the United States. Baseball, once considered the U.S. “National Pastime,” is now well established across most of Asia, the Caribbean, Australia and South America. Many countries have developed their own culturally unique sports, like sumo wrestling in Japan, bandy in Russia and korfball in the Netherlands.
The Best-Howard Model takes a global perspective, drawing from every credible data source on sports participation and spending from all regions and countries of the world. Oxford Economics, a leader in global forecasting and quantitative analysis, provides the model data on personal and household spending patterns for 10 countries and 25 major cities worldwide. The Best-Howard Model uses the robust economic data to correlate the impact of variables like household disposable income on average annual sports spending. The analysis allows comparisons of average household spending on categories like sportswear from one city to another.
The Best-Howard Model includes several previously overlooked sports industry segments. The model places heavy emphasis on the Fan Engagement domain, recognizing fan attachment to sports leagues and teams is critical for behaviors like attending, viewing, traveling and wagering.
The model also incorporates the many ways and settings in which people can engage in sports, from video gaming, to fantasy sports, to sharing experiences with friends in sports bars.
In addition to equipment used directly in sports, the Sports Products domain captures all the products and services sustaining the health and wellbeing of those who actively participate, from sports nutrition products to the rapidly growing core area of Sports Medicine.
The Best-Howard Model also recognizes a range of recreational sports, including enormously popular activities like RV camping and the new and rapidly growing luxury camping, or “glamping,” segment, as well as emerging outdoor pursuits like bouldering. Also included is the nearly $200 billion global equestrian industry, which has been largely ignored in previous sports industry estimates.
FIGURE 1.9
Size of Sports Industry 2019 (U.S. billions)

The Best-Howard Model, as described in Figure 1.9, measures each segment of its three major domains separately. The model uses a bottom-up approach to collecting and aggregating participation and revenue data starting with the 36 segments shown in Figure 1.7. For each segment, the model uses data specific to the United States and, where possible, from other world countries and regions. The Best-Howard Model synthesizes segment-level spending to
14
Copyright 2022 Global Sports Insights
The Global Sports Industry
Defining the Sports Industry
provide an expansive size estimate of the nine core areas. The model then uses the core area revenues to produce size estimates for each domain.
The Best-Howard Model finds the sports industry’s total value came to $2.3 trillion in 2019, the largest estimate of the industry’s economic magnitude and exceeding the nearest estimate by Plunkett Research by almost $1 trillion dollars.
COVID-19 dramatically impacted sports industry revenues worldwide beginning in 2020. Highlighted throughout this book are assessments of the virus’s impacts on each sports industry segment. In future editions, 2019 participation and spending data will serve as benchmarks against which the Best-Howard Model will measure recovery rates across each core area.
Still, $2.3 trillion is likely a conservative estimate for the value of the global sports industry. Credible global data does not exist in several areas. For example, estimated annual sports wagering spending ranges from $200 billion to $500 billion. While IBISWorld (6) offers credible annual global sports betting estimates, its revenue figure represents net income, or what is left after prize money is removed. As much as 7% to 10% of the actual amount wagered (i.e., the “handle”) is not included. The Best-Howard Model adjusts the IBISWorld figure by reintroducing the 7% and providing a more accurate wagering estimate. However, the model’s estimate of $234 billion includes only legal activity in 2019, ignoring the significant amount of illegal betting taking place in every corner of the world. It is possible the Best-Howard Model’s estimate captures only half the money spent on sports gambling.
Data Warehousing
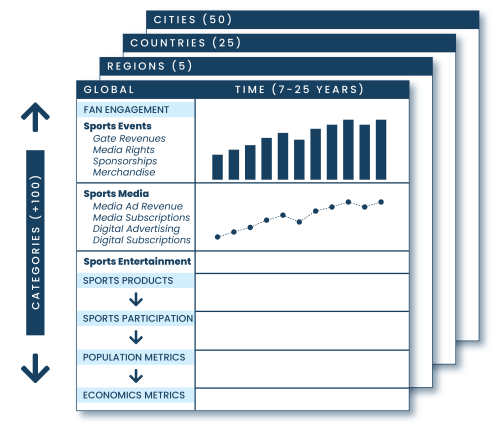
The Best-Howard Model serves as a framework for aggregating sports industry data. As shown in Figure 1.10, the data is allocated and stored in a warehouse containing more than 250,000 data points. The data are assigned to one of the model’s three major domains: Fan Engagement, Sports Products or Sports Participation. They are then further sorted by best fit to a core area (e.g., Sports Events, Sports Entertainment) and assigned to the most relevant segment (e.g., media rights, sponsorships). The tiered arrangement allows users to move quickly from a broad to focused perspective.
The data warehouse also stores socioeconomic data, drawn mainly from population statistics and Oxford Economics metrics like retail sales and household consumer spending. The data, which extends back to 1980 and projects to 2050, is updated monthly. The data features prominently in Chapters 11 and 12 of this book, revealing key socioeconomic variables’ impact on sports spending across segments, including apparel and event revenues, in 10 countries and 50 major cities worldwide.
Some challenges arise when collecting sports, recreation products and activity data in several Best-Howard Model core areas. U.S. data is typically more trustworthy than that from other world regions. Reputable publishers like IBISWorld and Statista provide reliable figures on U.S. participation rates and spending across a broad spectrum of sports, fitness and recreation activities. While both organizations aggregate data on a global perspective, their worldwide coverage is not comprehensive. IBISWorld focuses mostly on U.S. sectors, with the exception of sports betting, which the firm analyzes around the world.
Several U.S. government agencies provide information on sports and recreation activities. The U.S. Census Bureau tracks product and activity expenditures across almost all 36 Best-
Copyright 2022 Global Sports Insights
15
The Global Sports Industry
Defining the Sports Industry
FIGURE 1.10
Sports Industry - Data Warehouse
Howard Model segments. The U.S. Forest Service, U.S. Fish & Wildlife Service and National Park Service collect and publish detailed annual participation and fee data across a range of outdoor activities. And many U.S. nonprofit organizations, such as the Aspen Institute (youth sports), Outdoor Industry Association (outdoor recreation) and American Horse Council Foundation (equestrian), publish sector-specific data. Sports and fitness trade associations and private organizations produce well-constructed, detailed annual reports. Examples include the National Sporting Goods Association’s annual Market Report, the Sports and Fitness Industry Association’s Topline Participation Report and Kampgrounds of America’s North American Camping Report. Finally, several business publications offer dedicated sports content, most prominently Forbes magazine’s annual financial North American sports league valuations and, more recently, Sportico.com’s in-depth insights into the business of sports.
On a global scale, reputable research aggregating firms like Statista and Euromonitor International provide market research on several Best-Howard Model segments. Euromonitor’s Passport site is the gold standard for understanding consumer spending across all Sportswear segments in 210 countries. High-quality industry-specific international reports include the International Health, Racquet & Sportsclub Association’s Global Report: State of the Health Club Industry, Laurent Vanant’s International Report on Snow & Mountain Tourism and Future Market’s Camping and Caravanning Markets.
Multinational firms like Deloitte and PricewaterhouseCoopers contribute significantly to the Best-Howard Model’s Sports Events core area. Both organizations provide valuable data and
16
Copyright 2022 Global Sports Insights
GET THE ONLINE BOOK TODAY!
The Global Sports Industry
Defining the Sports Industry
insights into the financial operations of major professional sports leagues and teams in North America and Europe. While the firms provide credible annual data for most of the Best-Howard Model’s components, global participation and revenue figures in areas like hunting and fishing, equestrian sports and youth sports are elusive. The model therefore uses either a conservative estimate or does not report data (NA) for those activities.
The extensive Best-Howard Model data warehouse also chronicles the impact of COVID-19 on every sports industry segment, allowing analysts to draw meaningful comparisons between recovery rates by sports type across countries and cities. The data is updated regularly, making the warehouse a vital resource for assessing how the sports industry rebounds from the virus.
Finally, the data warehouse is easily accessible. By clicking on the citation reference numbers throughout this digital book, readers can quickly see full underlying datasets. Many of the book’s interactive figures allow readers to navigate through several data layers, with each providing additional detail.
Breaking Down the Sports Industry
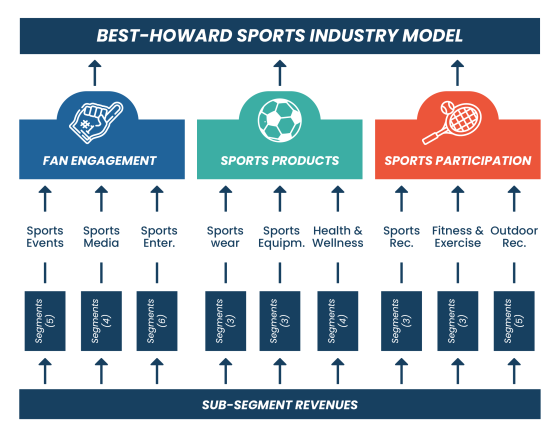
The Best-Howard Model shows the full economic value of the global sports industry is $2.3 trillion. The value is derived from a bottom-up approach, in which revenue estimates for 36 segments are compiled, then combined and summed for nine core areas, which are in turn aggregated for three domains (Figure 1.11).
FIGURE 1.11
Sports Industry - Bottom-Up Revenue Method
Copyright 2022 Global Sports Insights
17
The Global Sports Industry
Defining the Sports Industry
Figure 1.12 shows total revenues for the Best-Howard Model’s three domains. Sports Products, with its core areas of Sportswear, Sports Equipment and Sports Health & Wellness, is the largest contributor at $968.1 billion. One segment, recreational vehicles, accounts for $152.5 billion of the total. Unlike many market reports, which provide one summary estimate for the RV category, the model’s estimate includes revenues from six sub-segments: RVs, Recreational Boats, All-Terrain Vehicles, Jet Skis, Golf Carts, & Snowmobiles. Revenues for all six categories are used to estimate total annual RV spending. The Best-Howard Model replicates the bottom-up approach in all its model segments.
FIGURE 1.12
BEST-HOWARD Sports Industry Domains
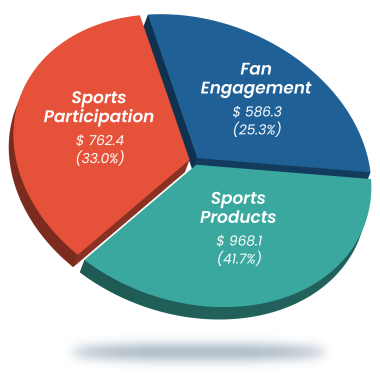
Sports Participation is the next largest domain, with total revenues of $762.4 billion. Annual sports and recreation participant spending is growing rapidly, primarily due to the expanding popularity of outdoor activities. In 2019, more than 70% of all Sports Participation domain revenues came from outdoor sports.
Outdoor pursuits continued to flourish during the COVID-19 pandemic, as individuals seeking refuge from the virus flocked to open-air, natural spaces. Leading the way was the surge in RV sales and the emergence of glamping.
Fan Engagement, while currently the smallest of the three domains at $586.3 billion, has a high revenue ceiling. The explosive sports betting growth around the globe drives the domain’s potential. Widespread legal sports wagering is a recent development in the United States. With as many as 30 states soon to offer legalized gambling, from lotteries to online sportsbooks, America’s share of worldwide betting is expected to soar over the next decade. Recently developed micro-betting, which allows enthusiasts to wager on every pitch of a baseball game or shot in an NBA telecast, stands to grow sports gambling further. For example, bettors might predict whether the NFL’s Dallas Cowboys will make a first down on
18
Copyright 2022 Global Sports Insights
The Global Sports Industry
Defining the Sports Industry
their next play. The discrete occurrences offer hundreds of betting opportunities within every sporting event, and analysts believe micro-betting will soon account for a substantial share of all sports wagering.
The total global sports betting handle is forecast to exceed $300 billion by the mid-2020s. While more money is spent on global sports gambling than any other Best-Howard Model segment, other Sports Entertainment activities are also growing at spectacular rates. Fantasy sports, esports and sports video games all grew in popularity as restrictions imposed by the COVID-19 pandemic eliminated or diminished alternatives.
The Sports Industry: One of the World’s 10 Largest Industries
As shown in Figure 1.13, the Best-Howard Model has estimated the worldwide sports industry in 2019 to $2.3 trillion. This estimate is based on revenues from three major domains of the sports industry. Each domain is strategically unique, and its revenue derived from three core areas.
FIGURE 1.13
BEST-HOWARD MODEL – Sports Industry Revenues (U.S. billions)
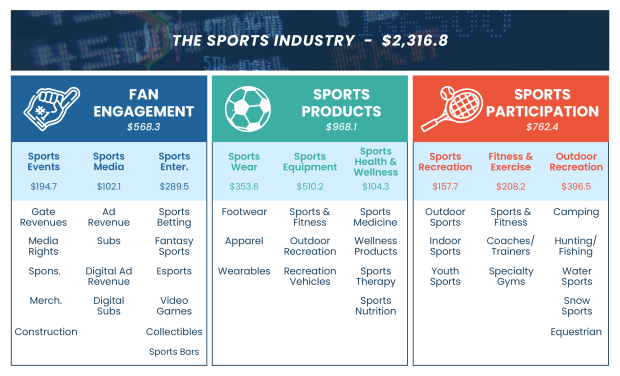
The segments under each core area create the core area revenue in this bottoms-up estimate of the worldwide sports industry. Part II of this book examines the fan engagement core areas and segment revenues in Chapters 2, 3 and 4. Part IV reports the core area and segment revenues for sports products in Chapters 5, 6 and 7. Part V focuses on the core areas and segments that make up sports participation domain in Chapters 8, 9, and 10. With regard to sports industry revenue, Chapter 11 presents the Top 10 sports cities and Chapter the Top 50 sports cities.
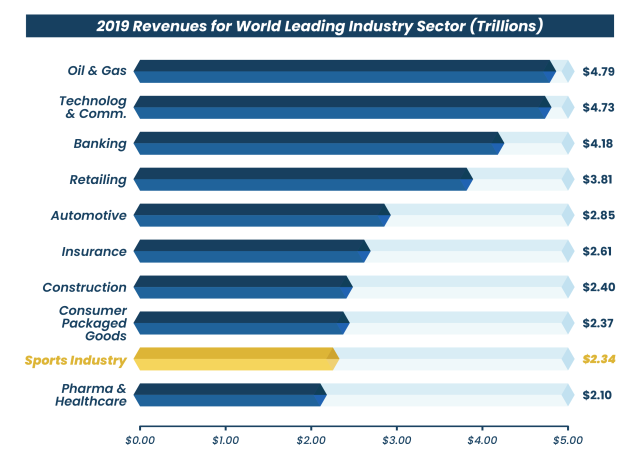
Aggregating all revenues from each Best-Howard Model domain, the total exceeds $2.3 trillion. The value places the global sports industry among the 10 largest industries in the world. In 2020, Forbes magazine reported the sales revenues for the top 10 industry sectors
Copyright 2022 Global Sports Insights
19
GET INSTRUCTOR COPY TODAY!
The Global Sports Industry
Defining the Sports Industry
around the globe (Figure 1.14) (7). At the top of the list is oil and gas at $4.8 trillion, followed by technology and communication ($4.73 trillion) and banking ($4.42 trillion). The global sports industry, valued at $2.3 trillion, ranks as the ninth largest industry, falling between consumer-packaged goods at $2.37 trillion and pharmaceuticals and healthcare at $2.10 trillion.
FIGURE 1.14
The Sports Industry Among Top 10 Industries in the World
The Impact of the COVID-19 Pandemic on the
Global Sports Industry
The COVID-19 pandemic altered the sports industry in ways no one could have predicted.
While its financial impacts have been substantial and enduring, they are also highly differential. Some sports and recreation activity areas flourished over the second half of 2020, while others suffered deep losses. Easily accessible online Fan Engagement options like sports betting and fantasy sports thrived. Providers of outdoor sports and recreation experiences, led by RV camping and pleasure boating, also did well. Hardest hit were professional and collegiate sports leagues deprived of live audiences and health and fitness clubs plagued by lockdowns and restrictions.
The final section of each of the next 9 chapters assesses the financial impact of the COVID-19 pandemic on each of the segments comprising the Best-Howard Model domains. The analysis will use 2019 pre-COVID revenues as the baseline for comparing 2020 gains and losses for each segment of the sports industry both globally and in the U.S.
20
Copyright 2022 Global Sports Insights
The Global Sports Industry
Defining the Sports Industry
To provide a more vivid and detailed understanding of the differential impacts of the virus across the sports industry, Figure 1.15 uses a heat map to show changes in revenue for each of the three domains of the Best-Howard Model (7). The heat map highlights the changes in magnitude along a continuum from -50% to +50%. Each interval represents a change of 10%. Declines on the left side of the spectrum range from intense red, representing losses up to 50%, to orange-yellow for losses less than 10%. On the right side of the scale, revenue increases move from pale green (+1.0% to 9.9%) to vivid green, representing a jump from 40% to 50%.
Figure 1.15 illustrates the severe impact of the novel coronavirus on two of the three Best-Howard Model domains in 2020. Both Fan Engagement and Sports Participation revenues fell dramatically in the United States and worldwide. Only the Sports Product domain continued to expand during the pandemic. Its growth resulted largely from the robust increase of the Recreation Vehicle segment, which set a new record for sales in 2020.
FIGURE 1.15
COVID-19 Impact Heat Map (U.S. billions)
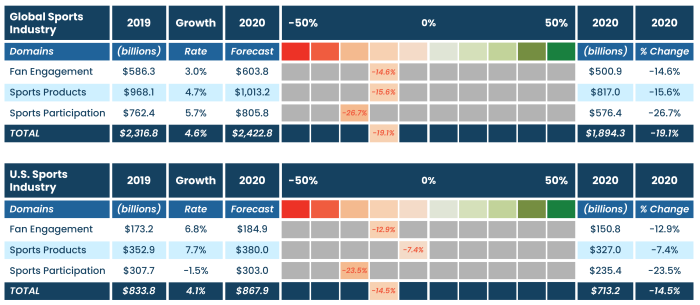
The heat maps show the variable effects of the pandemic across the three domains. The substantial revenue declines suffered by the Sports Participation and Fan Engagement domains resulted in a massive loss of $500 billion (US$) for the global sports industry in 2020.
Healthy pre-COVID-19 annual growth rates of 3.9% globally and 5.3% for the United States over the past decade plunged by 27% during the pandemic. Total global sports industry revenues fell from $2.33 trillion in 2019 to $1.70 trillion in 2020.
To better understand how the industry experienced a loss of such magnitude, we provide heat map analyses at the end of each chapter to illustrate the pandemic’s impact on each of the 36 Best-Howard model segments.
The segment heat maps provided in each chapter are shown in Figure 1.16. The colors indicate the magnitude of loss or gain for each segment, the brighter the red, the greater the loss; the deeper the green, the greater the gain. The deep losses suffered in the Sports
Copyright 2022 Global Sports Insights
21
The Global Sports Industry
Defining the Sports Industry
Participation domain can be explained by the fact that 9 of the 12 segments experienced revenue losses, some very severe including all four Fitness & Exercise segments, as well as youth sports and snow sports.
In contrast, the Sport Products domain shows the spectacular gains in green (40%+) for all four segments of the sports gear and equipment core area. Each of these segments benefited from the pandemic’s adverse impacts, from closed gyms and health clubs to a new-found urgency to find safe space outdoors.
FIGURE 1.16
Best-Howard Model Segment Heat Maps
SPORTS INDUSTRY MODEL


Percent Scale

Near-Term Prospects for the End of the COVID-19 Pandemic
The record-breaking pace at which new highly effective COVID-19 vaccines were developed in early 2021 brought hope that life would return to a post-pandemic “normal” by the end of the year.
Instead the slow rollout of vaccine supply and distribution and the emergence of new coronavirus variants early in the spring of 2021 led to a new spike in infection rates throughout most of the world. As summer approached, new cases were still rising across most of Europe, India, Russia, Brazil, as well as in the United States.
The widespread belief among health experts is that the spread of the COVID-19 virus won’t stop until enough people become vaccinated. The prevailing view is that “herd immunity” occurs when about 70% of the population becomes fully vaccinated. Achieving this threshold by the end of 2021 appears to be highly unlikely. As of April 15, 2021, only 11% of the world’s population had been vaccinated. In many wealthy western European nations, including Germany, France and Spain, less than 10% of the population had received all required doses by mid-April. Unless, the supply of vaccines can be dramatically increased and more evenly
22
Copyright 2022 Global Sports Insights
GET THE ONLINE BOOK TODAY!
The Global Sports Industry
Defining the Sports Industry
and efficiently distributed, it’s quite probable that the global pandemic will extend well into 2022.
Relative to many countries, the United States has a much higher probability of reaching the immunity threshold by year’s end. By May 15, 2021, nearly 25% of Americans were fully vaccinated. With approximately, 4 million shots being administered each day, the U.S. is on pace to achieve control of the virus’ spread as early as the fall of 2021. Of course, this all depends on the current vaccines providing protection against the constant threat of the emergence of new virus variants.
Given all the uncertainty, The Sports Industry will closely monitor the continuing impacts of the pandemic. Subsequent editions will track the recovery rates of every Best-Howard Model segment as the United States and other countries around the globe emerge from the pandemic.
Copyright 2022 Global Sports Insights
23
The Global Sports Industry
Defining the Sports Industry
References
We have added links to many references for direct and easy access. While we have tested each link, there are a few instances where the websites are no longer accessible. We will continue to monitor the accessibility of citation references and remove any links no longer active. In many instances the referenced data was purchased, this is noted.
1. Michael Milano and Packianathan Chelladurai, “Gross Domestic Sport Product: The Size of the Sport Industry in the United States,” Journal of Sport Management, 2011, 25 24-35.
2. Plunkett’s Sports & Recreation Industry Almanac 2020, Plunkett Research., Ltd, Houston Texas.
3. “Sports – $614 Billion Global Market Opportunities & Strategies to 2022,” May 14, 2019. Research and Markets. Businesswire (www.businesswire.com).
4. Richard Lipsey, “The Sporting Goods Industry,” McFarland Publishers, 2006.
5. Top 10 List of the World’s Most Popular Sports. Baller Status (ballerstatus.com).
6. Shawn McGrath, “Global Sports Betting & Lotteries,” November 2020. IBISWorld (my.ibisworld.com). (GSI Purchased Report)
7. “Oil and gas sector tops Forbes 2019 list of world’s largest public firms in revenue generation, finds Global Data,” August 20, 2019. Global Data (www.globaldata.com).

