Country Sports Power Score
A Sports Industry Analytic
By Dr. Roger Best and Dr. Dennis Howard
Each country has a certain potential for sports industry revenues based on the presence of pro sports teams, population, and the buying power of that country. Below are the Country Sports Power Scores for India, Brazil, and Norway, the metrics used to create these scores, and the sportswear revenues for each country. It is particularly interesting to note how the sportswear revenue per household varied across these three countries.
Each country is different in how these three forces shape country sports industry revenues concerning fan engagement, sports products, and sports participation. The purpose of this blog is to present a Country Sports Power Score based on these forces that shape country sports industry revenues.
Country Sports Power Score
Pro Teams, People & Buying Power
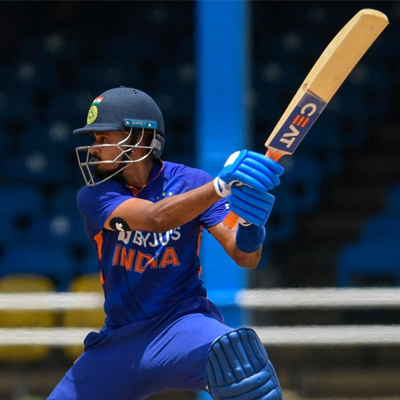
INDIA
Sports Power Score: 32
Pro Teams: 106 Households (mil) 306.8 Spending (bil) $3790
Sportswear Revenues
Country (bil): $9.0 Rev./Household: $29
BRAZIL

Sports Power Score: 32
Pro Teams: 120 Households (mil) 68.2 Spending (bil) $4,405
Sportswear Revenues
Country (bil): $7.4 Rev./Household: $108
NORWAY

Sports Power Score: 4
Pro Teams: 16 Households (mil) 5.4 Spending (bil) $69,083
Sportswear Revenues
Country (bil): $1.7 Rev./Household: $696
Forces that Shape Country Sports Power Score

PRO TEAMS: Country pro teams offer sports events, media, and entertainment.
POPULATION: Large country populations create elevated demand for sports tickets, products, and participation.
BUYING POWER: Country consumer spending allows for the purchase of sports tickets, sports products, and sports participation
Using country data, we constructed the three metrics to create a Country Sports Power Score using the same methodology employed by the well-known Buying Power Index (1).
- Pro Teams Index (.40) = (Number Pro Teams / Benchmark Score) x 100
- Households Index (.10)= (Number Households/ Benchmark Score) x 100
- Spending Index (.50)= (Country Consumer Spending / Benchmark Score) x 100
The benchmark score are created from the maximum score for each metric among the 35 countries identified as top sports countries. Germany had the highest number of professional teams, 184, making it the benchmark for this metric. The Pro Teams Index ranged from 6.5 to 100, averaging 45.8. For the household metric, China had the largest number of households at 479.6 million, and this index ranged from 0.5 to 100. The United States had the highest level of consumer spending at $13.6 trillion to establish this benchmark. The Spending Index ranged from 0.6 to 100.
Country-Level Sports Power Score
Using the weights shown for each country index, and overall sports power score was created for the top 35 countries in the world. To illustrate this, we have provided how we arrived at a score of 45 for England using the three country indices for England and the weights shown in parentheses.
England – Sports Power Score (45)
PRO TEAMS (.4)
(number)
- Benchmark: 184
- London: 175
- Country Index: 95.1
HOUSEHOLDS (.1)
(millions)
- Benchmark: 479.6
- London: 28.0
- Country Index: 5.8
SPENDING (.5)
(billions)
- Benchmark: $13,561
- London: $1780
- Country Index: 13.1
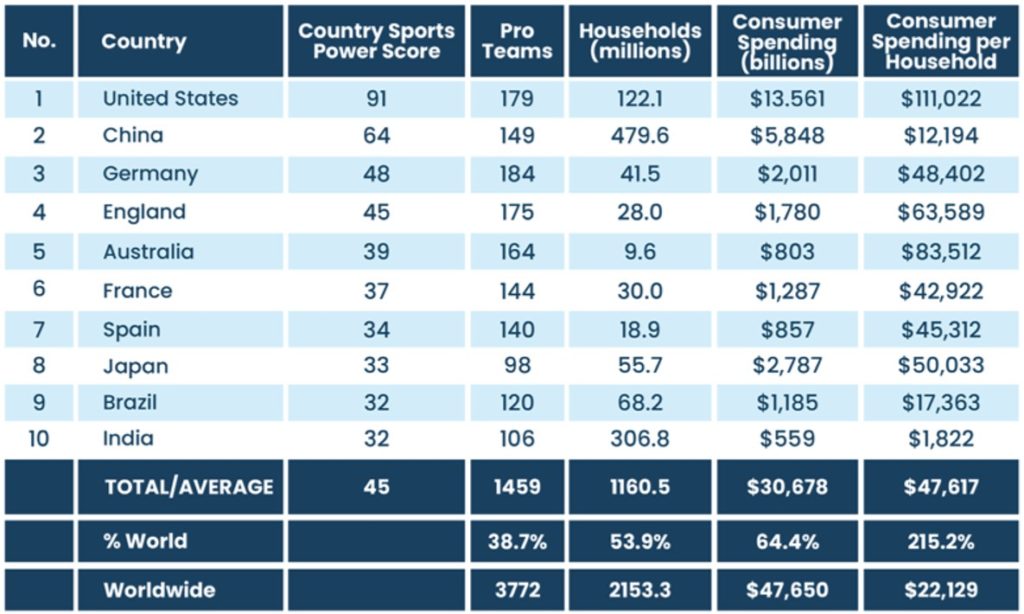
Applying this methodology, we determined the Country Sports Power Scores for the top 35 sports countries. Below are the Top 10 Sports Countries based on their Country Sports Power Score.
We provide two examples to illustrate the impact the composite Country Sports Power Score has on the amount spent on two prominent sports industry sectors, sportswear and health clubs.
Below is the relationship between Country Sports Power Score and Country Sportswear Revenues. In this example, 96% of the variance in country sportswear revenues could be explained by a country’s sports power score. The red dot locates England in this relationship.

The analysis below examines the relationship between Country Sports Power Score and Country Health Club Revenues. In this example, 89% of the variance in country health club revenues could be explained by a country’s sports power score. The red dot locates England in this relationship.
Both examples illustrate the potential importance of the Country Sports Power Score for assessing the sports industry revenues for a country. In both examples, the combination of pro sports teams, population, and consumer spending provided a sound platform for purchasing sports industry products and services.

Chapter 11 of The Global Sports Industry provides a detailed explanation using the top 35 sports countries using this Sports Industry Analytic. Preview Chapter 1, Defining the Sports Industry, at www.globalsportsinsights.com.
1.“Buying Power Index: Definition & Calculation,” Study (study.com).