Preview table of contents and sample page
About This Report
Sports events may be built on passion—but they’re powered by strategy.
Behind every roaring crowd and halftime show is a finely tuned revenue machine. In fact, global sports events generated over $160 billion in 2024 alone, making them one of the largest segments of the global sports industry. A new report breaks down the five key revenue streams that turn every whistle and walk-on into profit.
– Sponsorships now surpass all other event revenues, driven by global brands leveraging in-venue assets, digital overlays, and naming rights. In some leagues, sponsorship accounts for over 40% of total event revenue.
– Merchandise goes far beyond apparel. Teams now profit from limited-edition drops, athlete-led branding, and licensed digital goods—tapping into fans’ identities on and offline.
– Gate Revenues remain critical in certain markets, especially as dynamic pricing, premium seating, and in-stadium tech enhance per-capita spending.

Venue Construction has accelerated, with new arenas designed to maximize both game-day revenue and non-sports event hosting. These venues often serve as anchors for broader urban development.
– Media Rights continue to surge globally. With streaming platforms entering the space, leagues are striking multi-billion-dollar deals that monetize both reach and exclusivity.
Together, these five pillars form a sophisticated business model that transforms fan attention into long-term value. And while each stream has its own dynamics, they’re increasingly interconnected—making sports events one of the most complex, lucrative engines in the industry.
The full report explores:
- Regional and global revenue trends across all five categories
- How sponsorships overtook traditional revenue streams
- The real estate economics behind modern stadiums
- Merchandise trends tied to identity and scarcity
- The broadcast arms race reshaping media rights
Sports Industry Report
Contents
CONTENTS
Sample Page 1

The Heart of Sports Business
The heart of the sports industry is the hundreds of thousands of organized games, matches, and races that occur around the globe each year. Fueled by competition, drama, and pageantry, passionate fans in the hundreds of millions attend and watch sports events played in ever more lavish and expensive stadiums and arenas.
Gate receipts are just one component of the revenues derived from sports events. Money spent by fans to park and to purchase food and beverages adds to event revenue, as does the sale of media rights. Media companies pay teams and leagues to broadcast their events on TV, radio, or the Internet. (Figure 1.1).
FIGURE 1.1
Sports Events Segments

Sponsorships – money a corporation pays to a team to advertise and promote its brand at events – are another important source of sports event revenue. Sponsorships can range from placing brand names or logos on player jerseys to investing millions in placing a corporation’s name on a stadium or arena.
The sale of team or league merchandise at events, in retail stores, or online also provides revenue for teams, leagues, and sometimes athletes.
Finally, the billions invested in constructing a new generation of “state of the art” stadiums
and arenas full of expensive luxury seating options and amenities has produced abundant income streams for team owners and event operators.
Copyright 2025 The Business of Sports
01
Sample Page 6
Sports Events
Figure 1.5 examines the performance of each event revenue source from a global perspective (6). Overall, event revenues worldwide reached an all-time high of $234.5 billion in 2024, exceeding pre-COVID levels by a significant margin. The substantial increase in corporate sponsorship support has been a key factor in global growth. By 2024, Sponsorship spending accounted for nearly 40% of total event-specific revenues. Notably, gate revenues have yet to recover fully. This is due largely to the lingering effects of COVID-19 in many Asian and European countries. While growing substantially to $44.4 billion in 2024, worldwide gate revenues remain $5 billion below the pre-pandemic peak of $49.4 billion in 2019.
FIGURE 1.6
North American Sports Events Revenues, 2019 – 2024, (billions)
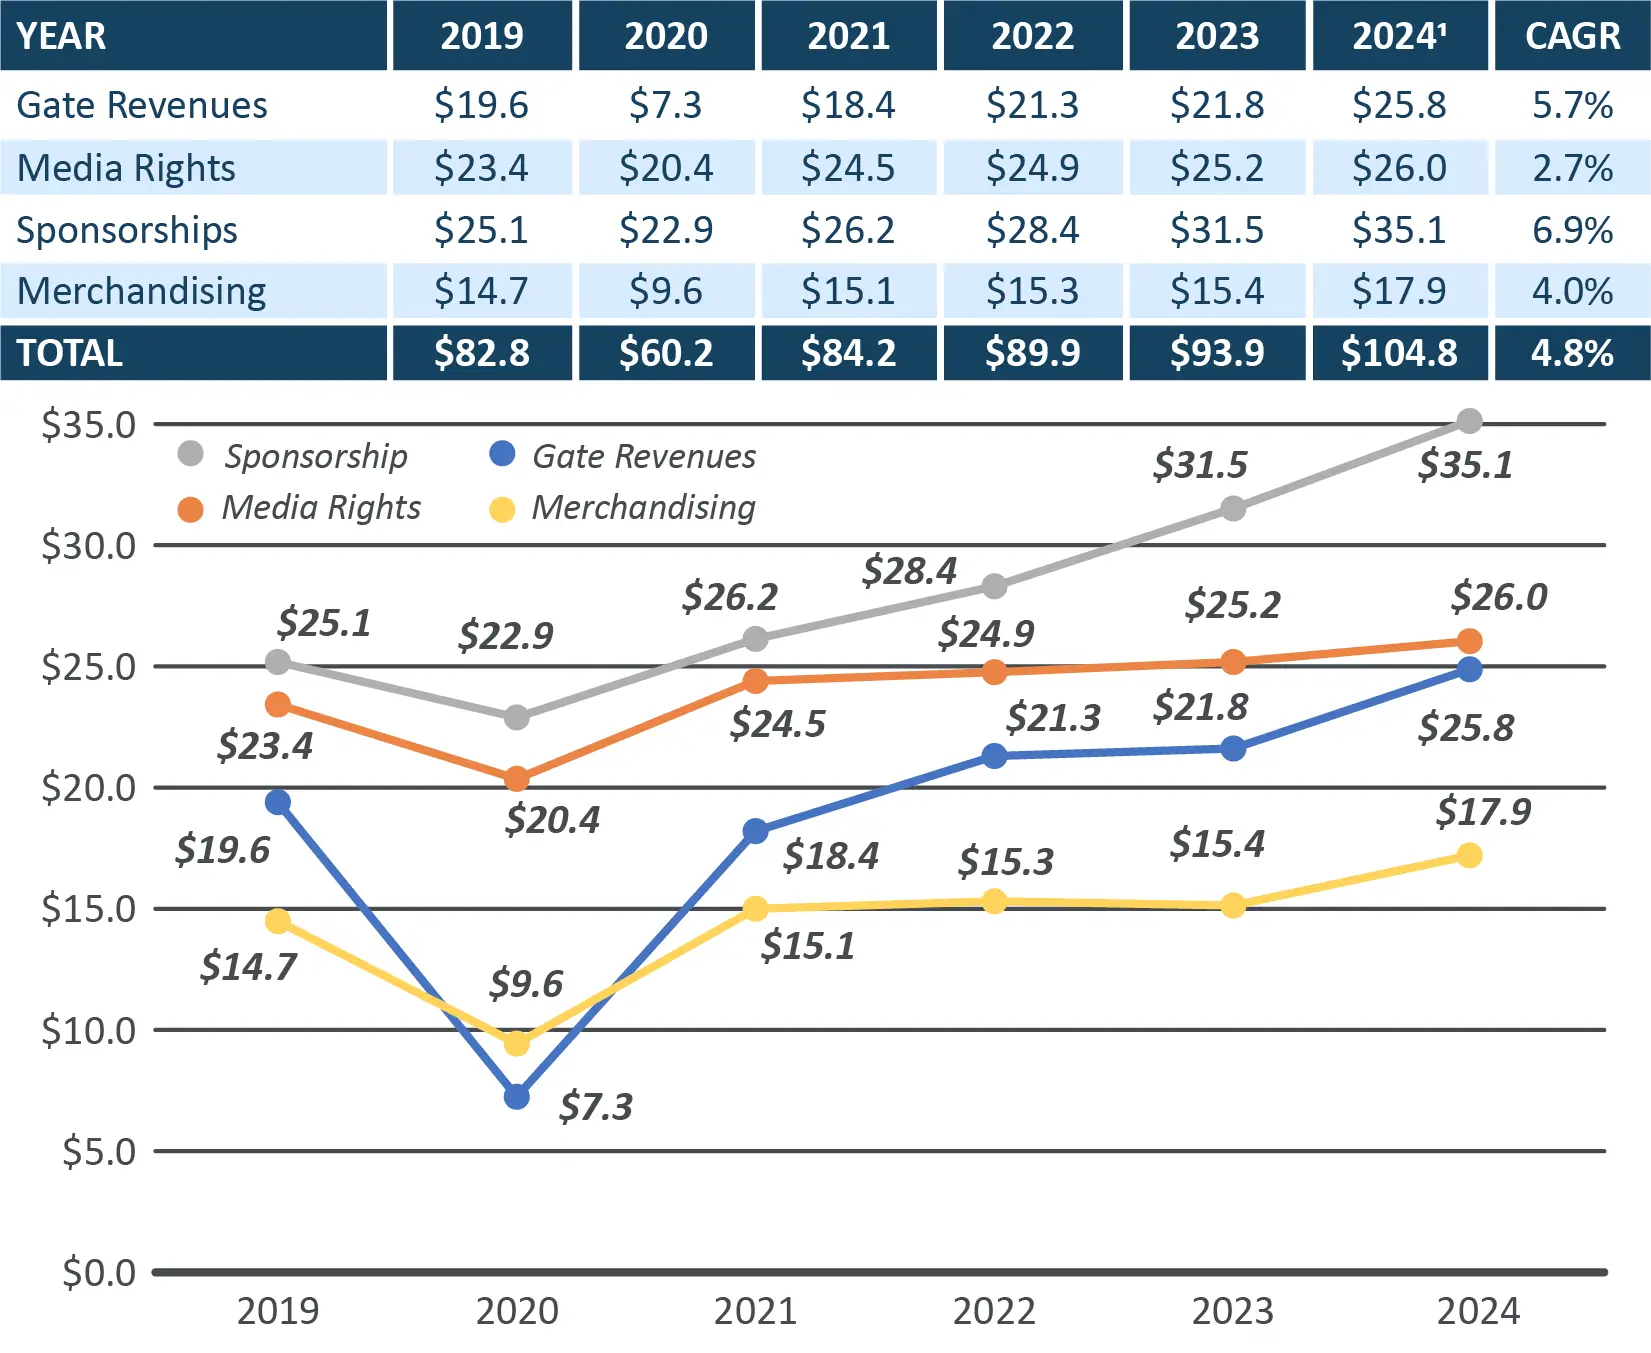
Figure 1.6 focuses on the North American events market (7). The first thing to note is the region’s enormous share of global event revenue. In 2024, the United States and Canada generated an estimated $104.8 billion in revenues, 44.3% of the worldwide event total. An examination of annual figures reveals that both North America and the rest of the world recovered rapidly from the depths of the global pandemic in 2020. The U.S. and Canada’s cumulative annual growth rate (CAGR) from 2020 to 2024 was a robust 15 percent. The global recovery rate shown in Figure 1.5 was also a healthy 14%, buttressed by North America’s substantial contribution. The impact of the U.S. on event revenues will be expanded upon in the next section, which examines the performance of each of the four event sources in greater detail.
06
Copyright 2025 The Business of Sports
Sample Page 28
Sport Events
As shown in Figure 1.25, the “Billion Dollar” era is already well established. Since MLB’s New York Yankees and the NFL’s Dallas Cowboys both eclipsed the billion-dollar barrier in 2009, 12 of the major U.S. sports facilities constructed have also crossed the threshold. The most expensive stadium built to date in the world is SoFi Stadium, home of the NFL Los Angeles Rams and Chargers (see Figure 1.26). The most common estimate of its cost when the venue opened in 2016 was $5 billion (61). However, a recent examination of SoFi’s construction raised the current cost to $6.75 billion when accounting for inflation adjusted dollars (62).
FIGURE 1.26
SoFi Stadium, the World’s Most Expensive Sports Facility

While largely an American phenomenon, sports venues recently constructed or renovated in Asia and Europe have also surpassed the billion-dollar boundary. Japan’s National Stadium 68,000-seat, multi-purpose stadium opened in 2019. Originally projected to cost $1 billion, the final build out cost of the 2021 Olympic stadium was estimated to reach $2 billion (63).
China’s $1.1 billion Xi’an International Football Centre opened in 2023. Built-in China’s ancient capital, the 60,000-seat saddle-shaped event center hosted the 2023 Asian Football Confederation Asian Cup (Figure 1.28). Widely recognized as one of the best football grounds in the world, the Tottenham Hotspurs opened their $1.2 billion stadium in North London in 2019. And, Spain’s Real Madrid’s COVID-19-impacted stadium renovation will also eclipse billion dollars (64).
28
Copyright 2025 The Business of Sports