Preview table of contents and sample page

About this Report
This report is the result of an intensive search of the most current and credible data sources on this topic. In 2023, global spending on sports media reached a record $150.5 billion. The U.S. share accounted for nearly 44%, topping $67 billion. A detailed breakdown of revenues generated from commercial advertising on traditional TV and digital sports broadcasts is provided.
A 2021 global study found that at least two-thirds of the population in many countries viewed live sports on traditional television. More recent surveys report a rapid upswing in online viewing, with an increasing proportion of fans watching live events on computers or mobile devices. The emergence of less expensive and versatile digital options is crucial to ensuring that the vast majority of people who never attend live sporting events will still be able to watch their favorite teams.
The report examines the changing sports media landscape, focusing on three, interconnected factors:1) the popularity of live sports, 2) the massive loss of cable TV subscribers and programming and 3) the emergence of internet-based OTT and streaming platforms.
In many countries, traditional and cable TV remain the most popular sports viewing medium. In the United States, access is still dominated by network television as its four major networks have invested $129 billion for the exclusive rights to air North America’s major sports leagues (NFL, NBA, NHL, MLB) through 2028 and beyond. NFL live game telecasts accounted for 82 of the 100 most-watched games televised programs in the U.S. in 2022, generating 171 billion TV ad impressions.
However, the rapid growth of the internet and emergence of new streaming technologies is rapidly changing the media landscape. By 2022, nearly two-thirds of the world’s population were actively using the internet. By 2025, 73% of smartphone owners globally are projected to access the internet exclusively on their smartphones.
Sports properties and media platforms are adapting to the rapid changes in media viewing behavior. Prominent sports properties and well-known corporations, such as ESPN and Amazon, Apple and Disney have committed billions of dollars to capitalize on the popularity of live sports broadcasts. Disney’s ESPN was first media broadcaster to establish an exclusive streaming agreement with the German Bundesliga. More recently, Amazon invested $13 billion to purchase exclusive rights to stream NFL Thursday Night Football on Amazon Prime through 2033. For the first time, NBA fans will have access to streamed programming during the 2025-26 season, as Amazon committed $1.8 billion a year to stream live games on Thursday evenings. The rapid growth of sports streaming services globally is exemplified by DAZN. The European-based company has acquired the digital media rights to 75 sports properties across the globe.
Clearly, the momentum globally is moving towards more digital sports viewing. With the proliferation of streaming alternatives, 40.7% of sports fans worldwide now view live sports on one or more of these digital platforms.
Sports Industry Report
Contents
CONTENTS
Sample Page 1

Extending Fan Engagement
Many sports fans around the globe will never attend a live event to watch their favorite teams or players in person. For them, the only way to experience a sports event is by watching it on a television, computer or mobile device screen or listening to it on the radio. In many countries, traditional television is the overwhelming viewing option for watching live sports. A global survey of fan viewing behavior found two-thirds or more of respondents in Brazil (78%), Argentina (75%) France (74%), Indonesia (73%), Spain (68%), Italy (67%), China (66%) and India (66%) watched their favorite teams play on television (1). While TV remains the predominant viewing option in many countries, the rapid growth of online options allows an increasing share of fans to follow their favorite teams on mobile devices. A recent study in the United Kingdom found 59% of British sports fans prefer watching live sports exclusively on streaming platforms.
FIGURE 1.1
Evolution of Sports Media and Fan Engagement

Copyright 2025 The Business of Sports
01
Sample Page 13
Sports Media
FIGURE 1.6
It’s an Internet World: Some Key Stats
- By 2022, 4.9 billion people, 64.4% of the world’s population, were actively using the internet.
- Nearly 2 million new users access the internet annually.
- China leads the world in the number of people using the internet at 1bn, followed by India at 658m.
- U.S. and United Kingdom internet penetration rates exceed 90%.
- Africa has the smallest % of internet users at 33%, but new users are growing at a robust 13% a year.
- In 2022, 268 million smartphones were sold globally. By 2025, 73% of users worldwide will access the internet exclusively on their smartphones.
The Sports Streaming Ecosystem (Figure 1.7) summarizes the many internet-connected
viewing options now available to sports fans globally (39).
FIGURE 1.7
Sports Streaming Ecosystem
- Media-Branded Over-the-Top Services. Sky Sports Now, ESPN+, Paramount+ (CBS) and NBC’s Peacock feature live sports furnished by their parent networks.
- Skinny Bundles. Fubo TV, Sling TV, YouTube TV and other streaming platforms offer live sports programming via traditional broadcast networks.
- League-Branded Services. NBA Leagues Pass, NFL+ Games Pass and MLB TV offer league-specific game broadcasts.
- Sports-Exclusive Streaming Services. Digital startups DAZN, Fite TV and VSiN offer sports-specific content highlighting niches like boxing and sports betting
- Social Media Platforms. YouTube, Facebook, Twitter and other popular social media platforms have partnered with sports leagues and broadcasters worldwide to offer highlight packages and/or live short-form sports event programming.
With the proliferation of these streaming alternatives, 40.7% of sports fans worldwide now view live sports programming on one or more of these digital platforms (40). This figure may reflect the extent to which only those with access to internet-connected devices can view sports on streaming devices. A more accurate statistic of the full potential of these digital viewing options results from a recent survey of European sports fans in 14 countries that reported that 79% would watch live events exclusively on streaming platforms if available. Here’s why.
Copyright 2025 The Business of Sports
13
Sample Page 26
Sports Media
Sports Share of U.S. TV Advertising Continues to Grow
Standard Media Index (SMI), a global source of advertising spending data, reported that TV sports’ share (including live and other sports programming) of total ad spending on U.S. television has grown from 21% in 2019 to 26% in 2021 (74). Nielsen Sports in a separate analysis, found that “31% of U.S. linear TV ad revenues ($24.7 billion) depend on live sports programming” in 2022.
A long-term study of Return on Advertising Spend (ROAS) across various TV genres found that ads on sports, particularly live sports telecasts, produced the highest ROAS results (75). Ads placed by brands on live TV sports across multiple categories – Automobiles, Quick Service Restaurants, Consumer Package Goods – generated a return on ad spending 84% above average, substantially higher sales than the average TV ROAS for those 3 sectors on non-sports broadcasts. The NFL led the way, with ROAS at 2.5X for QSRs, 92% above average for automobile brands, and 89% above average for consumer-packaged goods (74). The study attributes fans’ emotional connection to their favorite teams and players during real-time TV broadcasts as a prime reason for the strong ROAS. Their heightened passion keeps viewers in their seats during commercial breaks (71).
Figure 1.16 highlights the substantial TV advertising revenue of some of the world’s most-watched sporting events. Of all the single-sport events occurring since 2022, the FIFA World Cup in Qatar attracted the largest viewing audience by a wide margin. The three-week, 35-match elimination- tournament between 32 of the world’s best national football (soccer) teams was watched by 5 billion viewers. The Championship game between Argentina and France drew 1.5 billion viewers, nearly 20% of the world’s population. Major brands (e.g., Coca-Cola, T-Mobile, Samsung) spent over $2 billion promoting their products on television and streaming platforms on the world’s biggest stage.
FIGURE 1.16
Major Global Sports Events Television Advertising Revenues (millions)
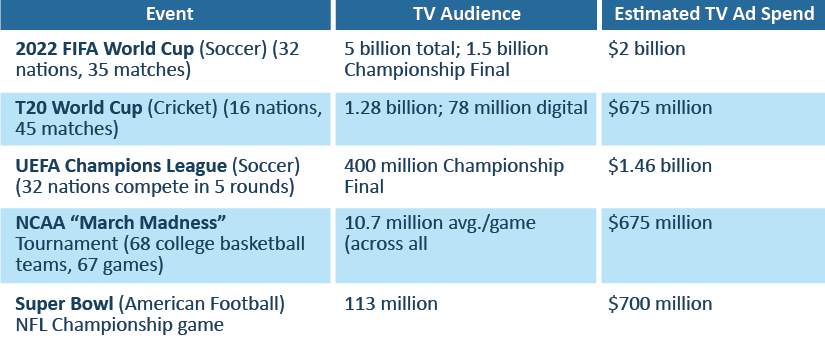
All but the National Football League (NFL) championship game, The Super Bowl, are elimination tournaments involving 35 to 67 matches or games. These extended global or regional (e.g., UEFA Champions League) competitions attract massive media audiences and serve as powerful advertising platforms. While the World Cup is the gold standard, its European counterpart, the UEFA Champions League, generates the next largest advertising investment, with brands purchasing nearly $1.5 billion in TV ad space during the 128 matches played through the Group and Knockout stages of the tournament. The UEFA Championship game attracted almost 4X more than the viewing audience of the NFL Super Bowl.
26
Copyright 2025 The Business of Sports