Sportswear allows us to engage in recreational activities in a way that enhances both physical performance and safety. Sportswear has been a major factor in athlete performance and consumer lifestyle. Today, sportswear is used by athletes, athleisure enthusiasts, people in the workplace, and everyday consumers seeking the comfort and fashion sportswear offers as summarized in the table below.
Sportswear revenues in 2023 were $450.8 billion worldwide and growing at 5.8% per year. These sportswear revenues were derived from the three-sportswear segments– sports footwear, apparel, and wearable devices. The global and U.S. revenues are provided over the last 5-years plus growth rates for ach of these segments as well as revenues for subsegments of performance, outdoor and sports inspired sportswear within each sportswear segment.
Sportswear has been a major factor in athlete performance and consumer lifestyle. Today, sportswear is used by athletes, athleisure enthusiasts, people in the workplace, and everyday consumers seeking the comfort and fashion sportswear offers. Before we get started on this core area of sports products, it is useful to review of how sportswear evolved in the video below.
FIGURE 1.1
The Evolution of Sportswear
Copyright 2025 The Business of Sports
1
Sample Page 13
Sportswear
FIGURE 1.14
U.S. Sportswear Sales Seasonality
Shoes designed for baseball, track, and basketball are designed to be particularly effective for the movements used in each sport.
In addition to functionality, sportswear is a fashion statement allowing consumers to project a desired look. Sportswear is also a big part of fan engagement. Professional and college teams provide sportswear featuring team colors, logos, and jersey numbers for fans to choose from.
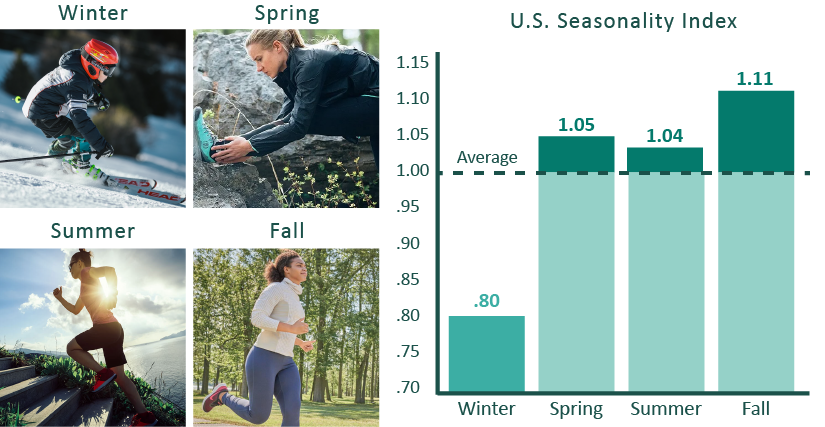
Sportswear Sales Seasonality
Figure 1.14 shows the seasonal effects of U. S. consumers buying sportswear (12). Seasonal influence is estimated with the seasonal indexes shown. Winter season U.S. sales are 20% below the yearly average and have a seasonality index of .80 (the average winter sales divided by average sales for a year).
In the spring and summer, U. S. sportswear sales are 4% to 5% higher than average. In the fall, sportswear sales are 11% above average due to back-to-school purchases and purchases related to college, professional sports, and holidays. The biggest adjustment to sportswear sales happens when sales go from 11% above average in the fall quarter to 20% below average in the winter quarter (Figure 1.14). The steep drop in sales creates an important challenge for production and supply chain management, as there is a 31% swing in average sales from fall to winter. Of course, seasonality’s effects are likely to differ worldwide based on differences in climate, consumer lifestyles, and buying power. Also, different sports have a seasonality which also impacts these seasonal averages.
Sports Footwear
Worldwide sports footwear sales grew 5.6% from $113.3 billion in 2018 to $175.1 billion in 2023. United States revenues were 27.8% of global sales in 2018 and will grow to 28.2% of worldwide sales in 2023. U. S. sales grew at a rate of 5.9% per year, as shown in Figure 1.15.
Copyright 2025 The Business of Sports
13
Sample Page 17
Sportswear
FIGURE 1.20
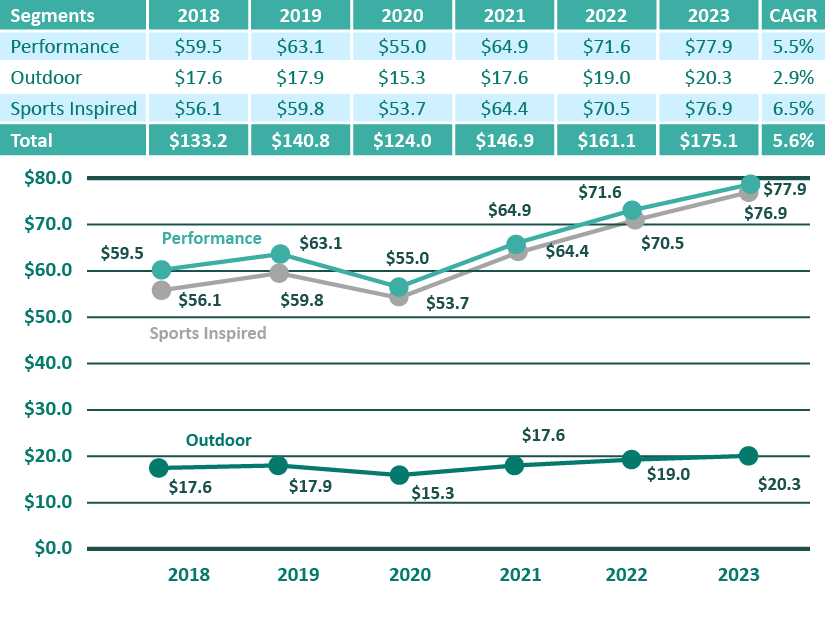
Sportswear Footwear Segments (billions)
FIGURE 1.21
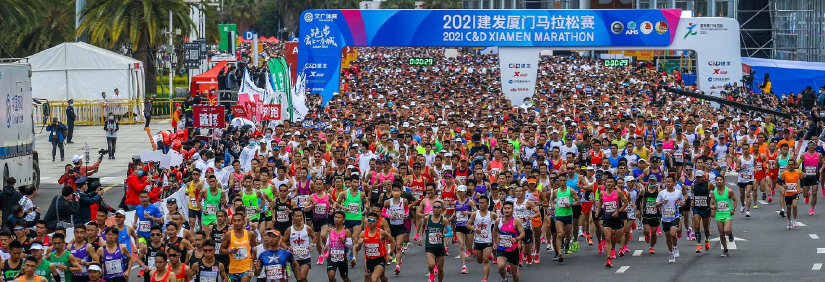
Running Growing in China
Running is Back: There are 621.2 million runners worldwide, driving sales of $11.56 billion in running gear (17). The U. S. is home to 60 million people engaged in running; Europe has 59.4 million; the Asia-Pacific region has 295 million. And Africa has 113 million runners. North America makes up 42% of the total sales of the running shoe market.
Running in China had been growing in popularity even before COVID-19. (Figure 1.21). There are now over 1 million marathon runners and over 100 marathons annually in China (18).